
Fig. 6. c-Rel inhibitor blocks tumor growth and MDSC development and enhances the effect of anti-PD1 therapy.
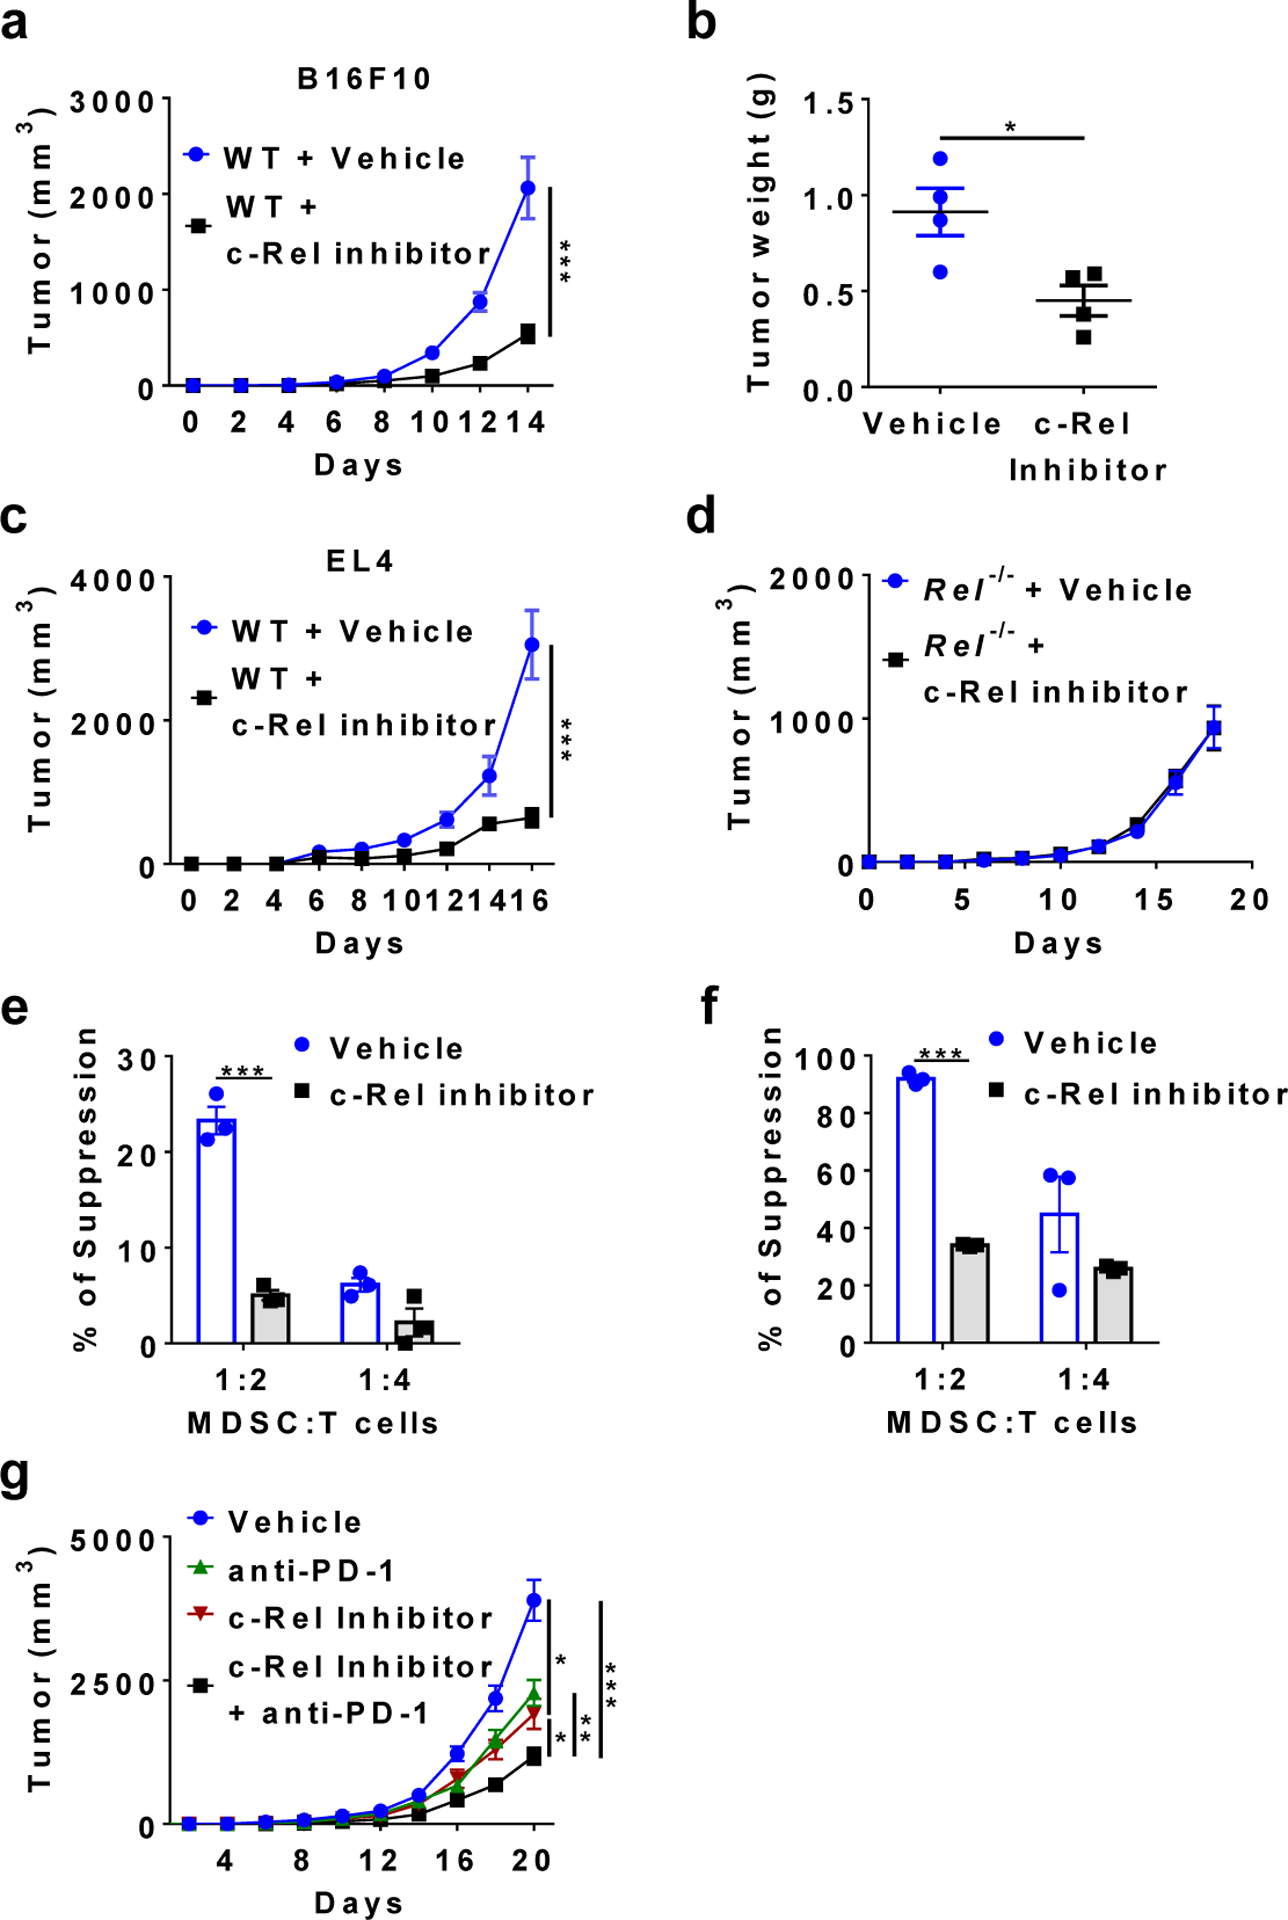
a, b, Tumor growth in WT mice that were injected s.c. with B16F10 cells and i.p. with c-Rel inhibitor (n=8) or vehicle control (n=9) (a), and tumor weight (n=4 in each group) at the end of the experiment (b). *, P=0.0196, ***, P=0.0001.
c, Tumor growth in WT mice that were injected s.c. with EL4 cells and i.p. with c-Rel inhibitor (n=6) or vehicle control (n=5). *, P=0.0003.
d, Tumor growth in Rel−/− mice that were injected s.c. with B16F10 cells and i.p. with c-Rel inhibitor (n=5) or vehicle control (n=3).
e, f, The degree of suppression of CD8+ T cell proliferation by purified Gr-1+ myeloid cells (MDSCs) isolated from mice described in a (e), or by MDSCs generated from bone marrow with or without c-Rel inhibitor (f). n=3 mice/group; ***, P<0.001.
g, Tumor growth in WT mice that were injected s.c. with B16F10 cells and i.p. with c-Rel inhibitor (n=9), anti-PD1 (n=10), c-Rel inhibitor+anti-PD1 (n=8), or vehicle (n=9) as indicated. *, P<0.05, **, P=0.0065, ***, P<0.0001.
Mice were injected with either 0.25×10⁶ tumor cells per mouse (g) or 0.5×10⁶ cells per mouse (a-d). Statistical significance was determined by Mann-Whitney U-test (a, c, g) or two-tailed unpaired t-test (b, e-f). Error bars indicate s.e.m.