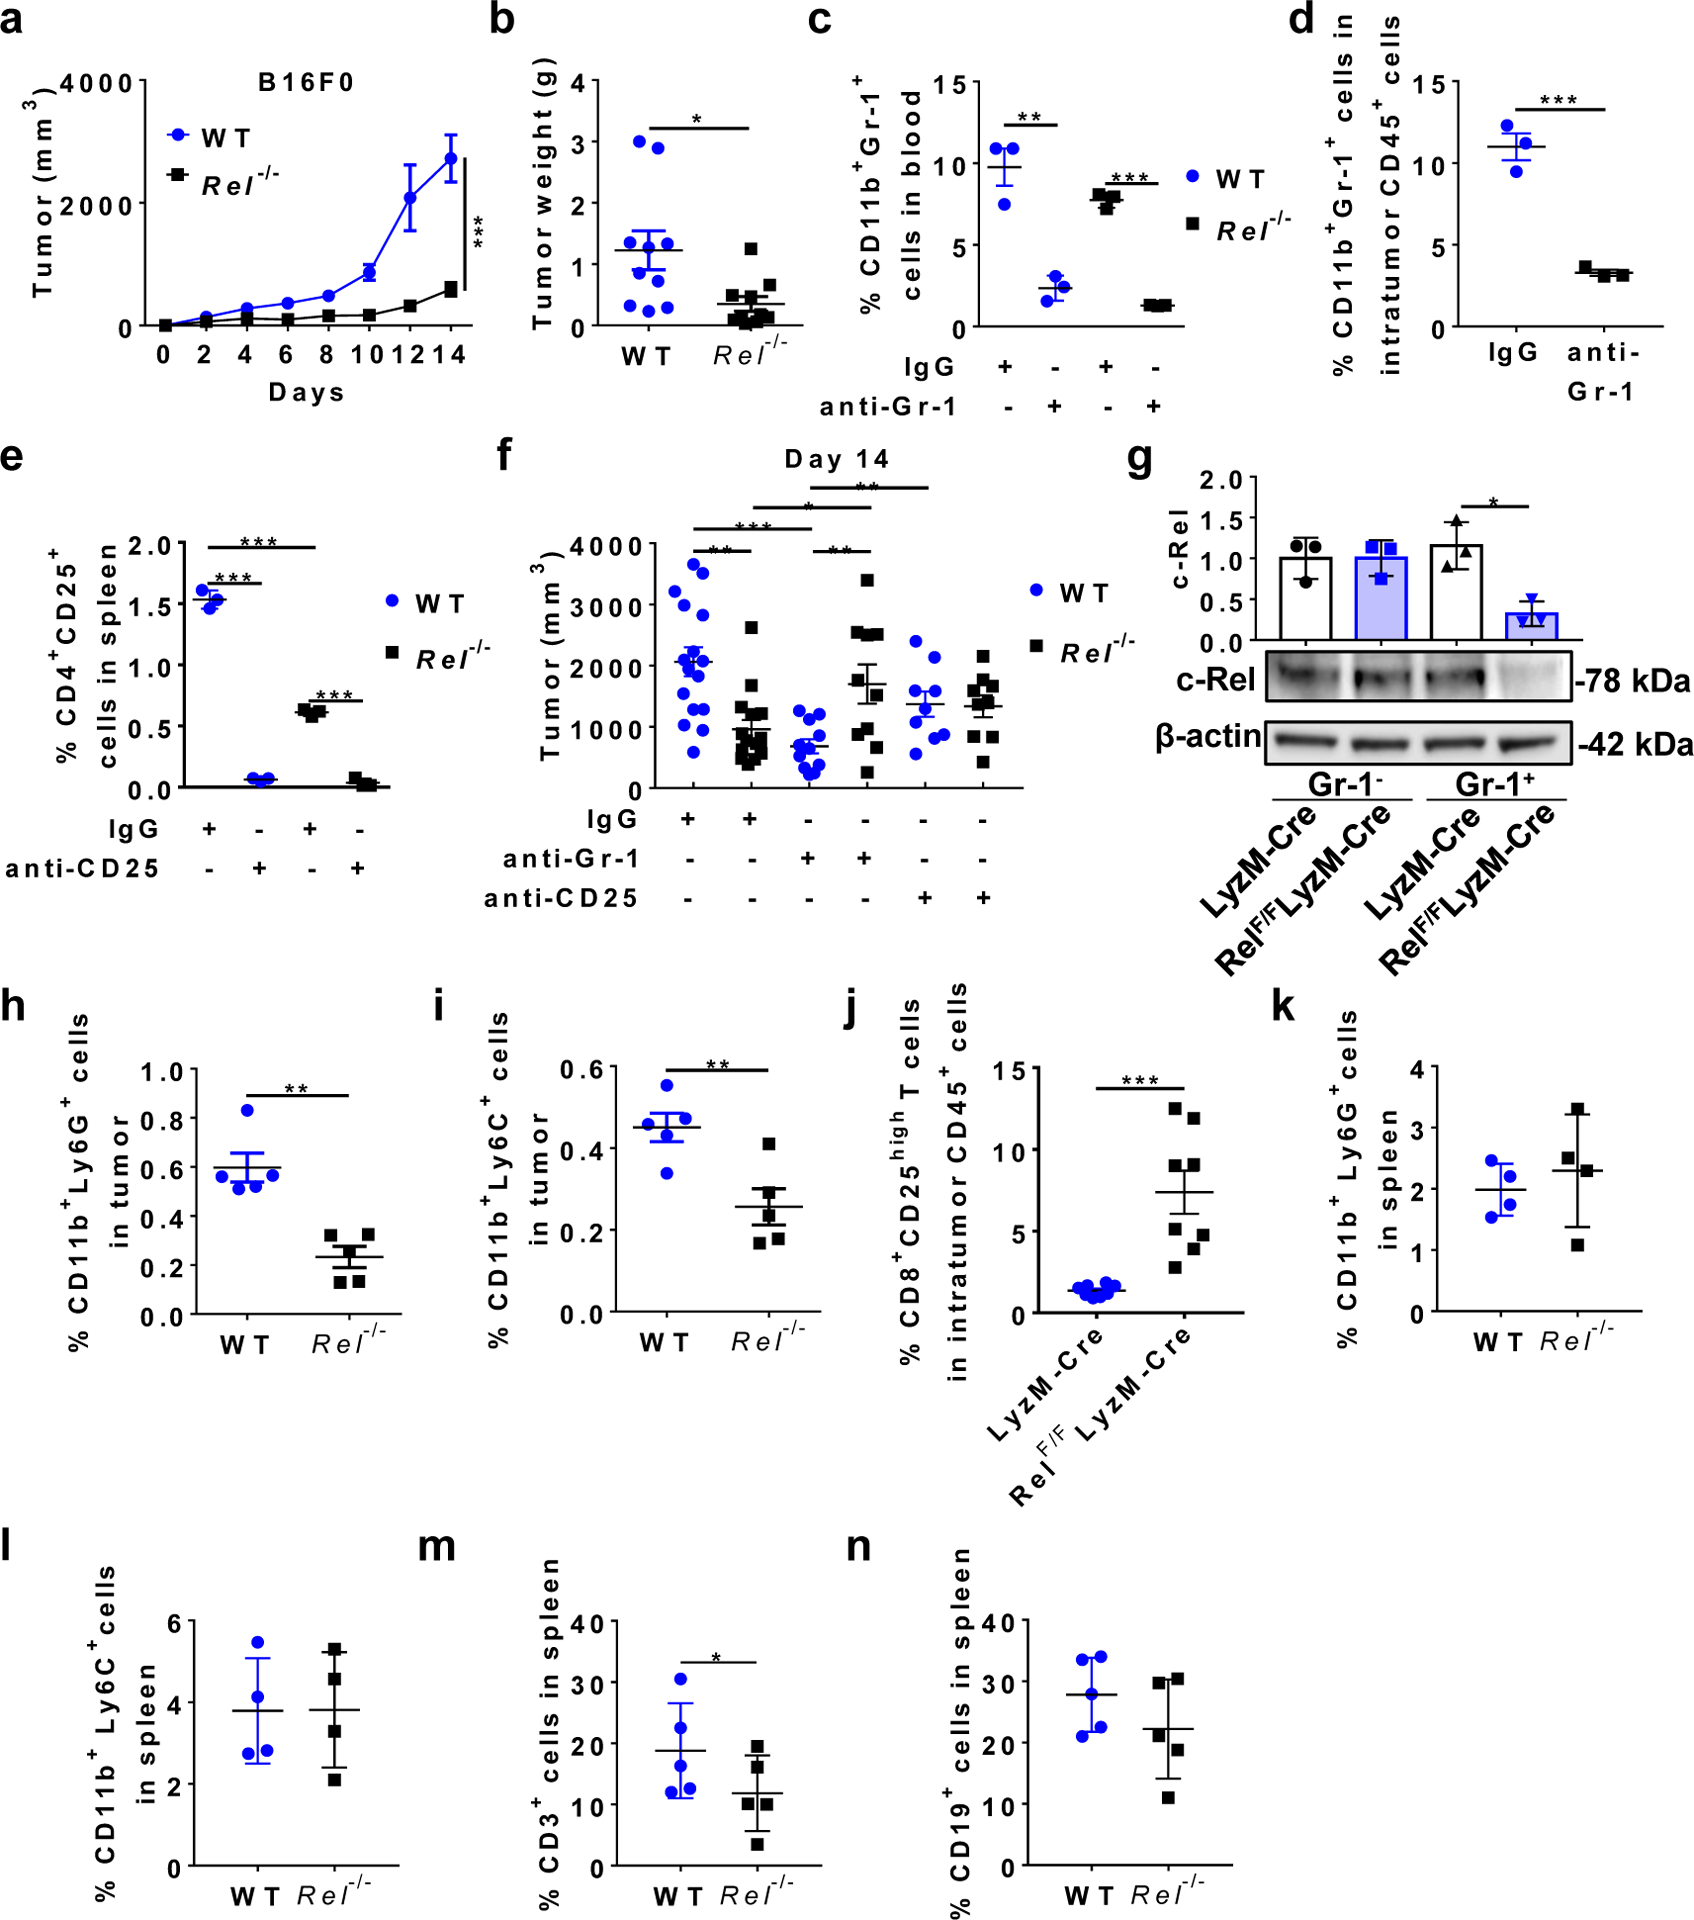
Extended Data Fig. 1 |. Global and myeloid Rel gene deletion blocks tumor growth and reduces MDSCs in mice.

a, Tumor growth in WT and Rel−/− mice (n=5 mice/group) injected s.c. with B16F0 tumor cells (***, P<0.0001). b, Tumor weight of WT and Rel−/− mice (n=10 mice/group) treated in Fig. 1a (*, P=0.0188). c, Percentages of CD11b+Gr-1+ cells in the blood of WT and Rel−/− mice treated with anti-Gr-1 or IgG isotype control (n=3 mice/group), 7 days post B16F10 tumor cell inoculation (**, P=0.0037; ***, P<0.0001). d, Percentages of CD11b+Gr-1+ cells in the tumor of WTmice treated with anti-Gr-1 or IgG isotype control (n=3 mice/group), 7 days post B16F10 tumor cell inoculation (***, P=0.0008). e, Percentages of CD4+CD25+ cells in the spleen of WT and Rel−/− mice treated with anti-CD25 or IgG isotype control (n=3 mice/group), 14 days post B16F10 tumor cell inoculation (***, P<0.0001). f, Tumor size on Day 14 of WT and Rel−/− mice treated as in Fig. 1c–e. n=16 for the WT+IgG group, n=15 for the Rel−/−+IgG group, n=11 for the WT+anti-Gr1 group, n=10 for the Rel−/−+anti-Gr1 group, n=9 for the WT+anti-CD25 group, and n=9 for the Rel−/−+anti-CD25 group (*, P=0.0303; **, P<0.01; ***, P=0.0001). g, c-Rel expression in Gr-1+ and Gr-1- splenocytes of LyzM-Cre (Cre) and LyzM-Cre RelF/F (RelF/F) tumor-bearing mice as determined by Western blot. Representative blots from biologically independent experiments were shown and the bar graph shows the relative quantities of the c-Rel protein in the corresponding group shown below (n=3 mice for each group; *, P=0.0101). h, i, Percentages of CD11b+Ly6G+ (h) and CD11b+Ly6C+ (i) leukocytes in the tumor of WT and Rel−/− mice treated in Fig. 1a (n=5 mice/group). **, P=0.0011 for panel h; **, P=0.0087 for panel i. j, Percentages of CD8+CD25+ leukocytes in the tumor of LyzM-Cre and LyzM-Cre RelF/F mice treated in Fig. 1f (n=8 mice/group; ***, P=0.0005). k-n, Percentages of the indicated leukocyte subsets in the spleen of WT and Rel−/− mice treated in Fig. 1a. (n=4 mice/group in the panels k and l; n=5 mice/group in the panels m and n; *, P=0.037) Statistical significance was determined by two-tailed Mann-Whitney U-test (a), two-tailed unpaired t-test (b-f, h-j, m), or one-way ANOVA with Turkey post-hoc test (g). For all panels, data are presented as means ± s.e.m.
