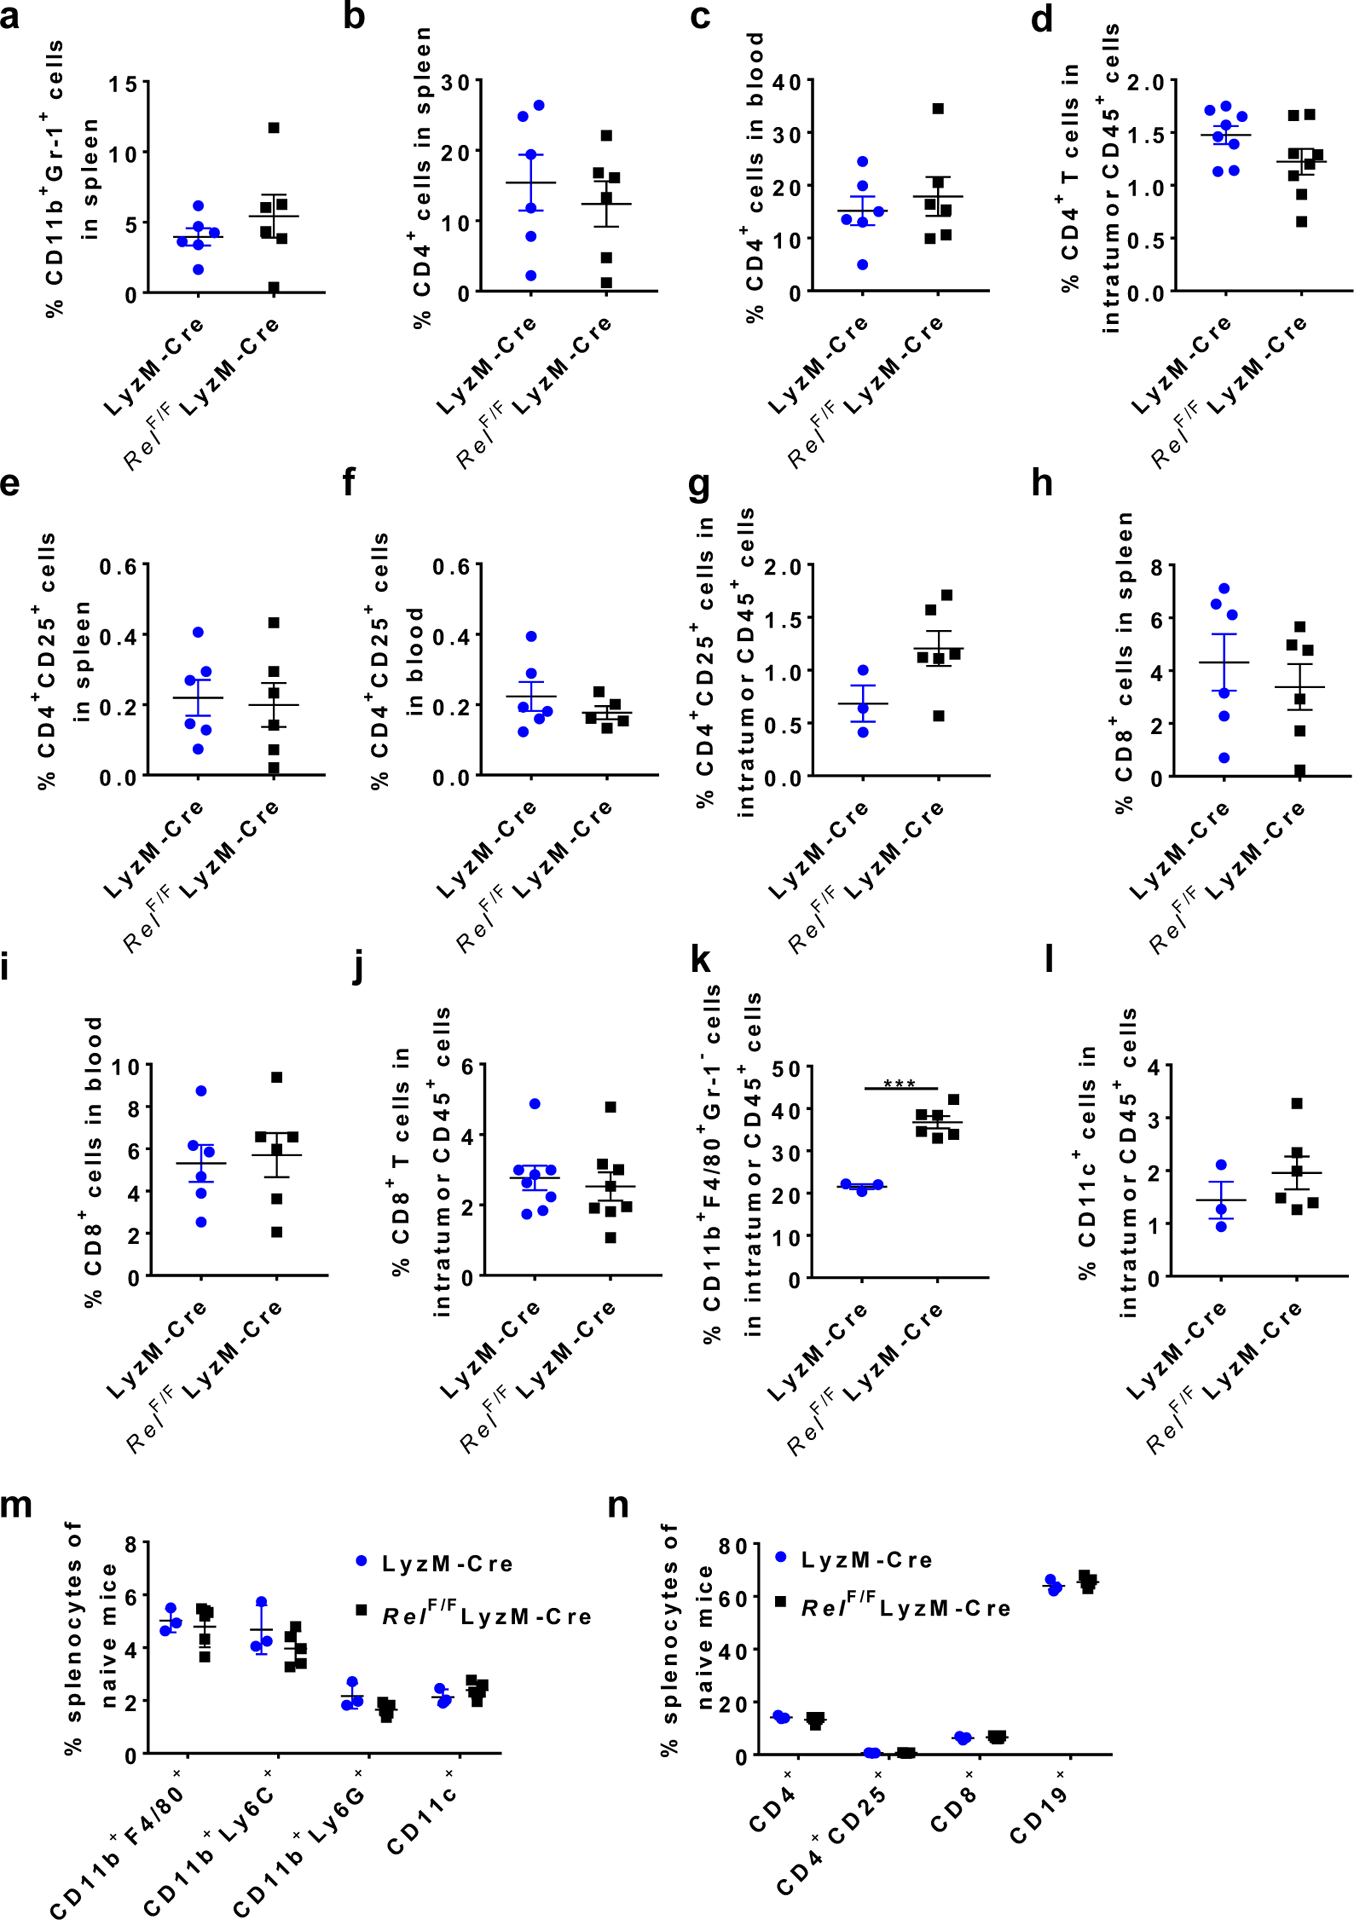
Extended Data Fig. 2 |. Percentages of immune cell subsets in cancer-bearing and naïve LyzM-Creand LyzM-CreRelF/F mice.

a,Percentages of CD11b+Gr-1+cells in the spleen of mice treated in Fig. 1f. n=6 mice/group. b-d,Percentages of CD4+cells in the spleen (b, n=6/group), blood (c, n=6/group), and tumor (d, n=8/group) of mice treated in Fig. 1f. e-g,Percentages of CD4+CD25+cells in the spleen (e, n=6/group), blood (f, n=6 for the LyzM-Cregroup and n=5 for the LyzM-CreRelF/F group), and tumor (g, n=3 for the LyzM-Cregroup and n=6 for the LyzM-CreRelF/F group) of mice treated in Fig. 1f. h-j,Percentages of CD8+cells in the spleen (h, n=6/group), blood (i, n=6/group), and tumor (j, n=8/group) of mice treated in Fig. 1f. k-n,Percentages of the indicated leukocyte subsets in the tumor (n=3 for the LyzM-Cregroup and n=6 for the LyzM-CreRelF/F group) of mice treated in Fig. 1f (k, l), and the spleen (n=3 for the LyzM-Cregroup and n=5 for the LyzM-CreRelF/F group) ofnaïvemice (m, n). (***, P=0.0002) Statistical significance was determined by two-tailed unpaired t-test (k). For all panels, data are presented as means ±s.e.m.
