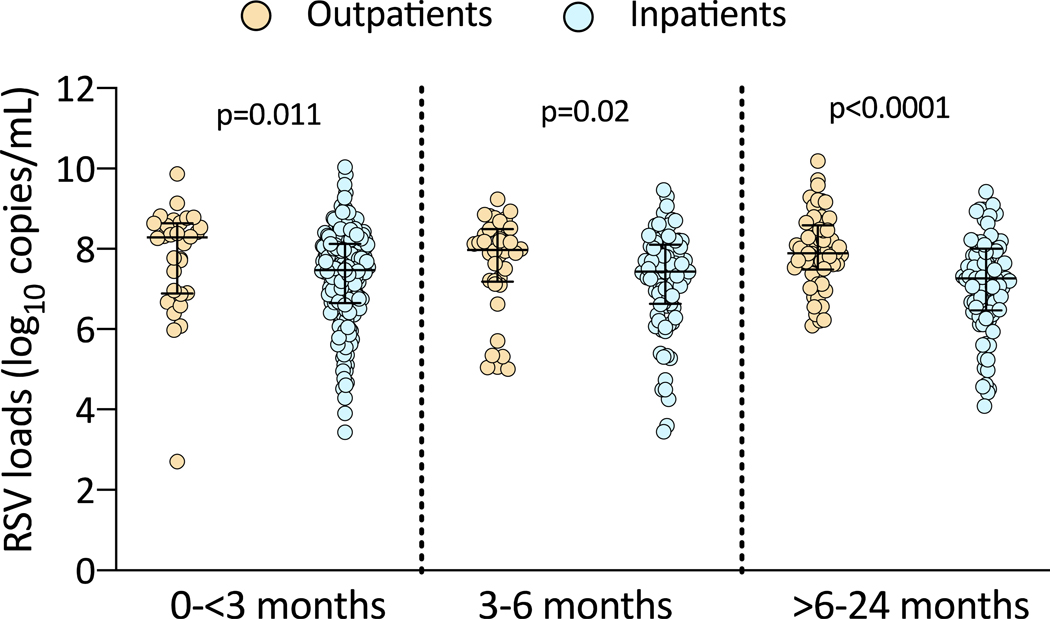
Figure 2. Viral load differences according to age in infants with RSV infection.
The Y axis represents RSV loads in log10 copies/mL and the X axis differences in viral loads in outpatients (orange) and inpatients (blue) in the three age groups. Comparisons by Mann Whitney test, two-tailed p values are provided in the graphs.

