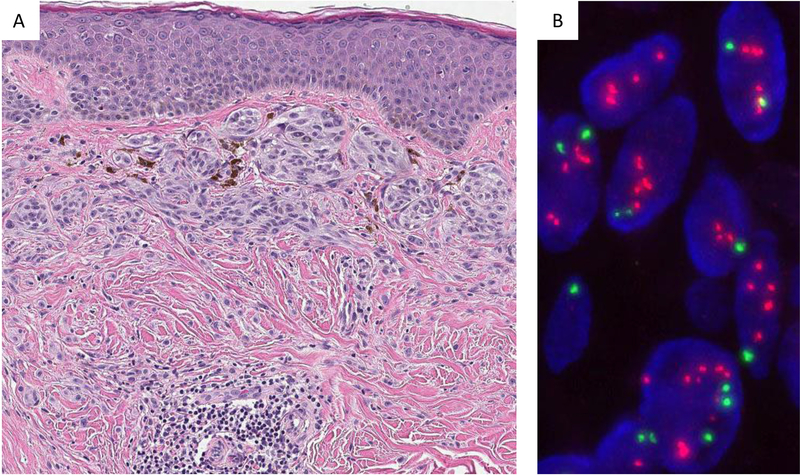
Figure 5.
FISH analysis for HRAS. Spitz nevus with partial dermal sclerosis (Case #17) (A). Analysis of the tumor cells by FISH (B) reveals amplification/gain of HRAS with a signal pattern of numerous and clustered HRAS signals (orange-red). CCP11 labelled in green serves as internal control to assess the HRAS/CCP11 ratio. CCP = centromeric chromosome probe of chromosome 11

