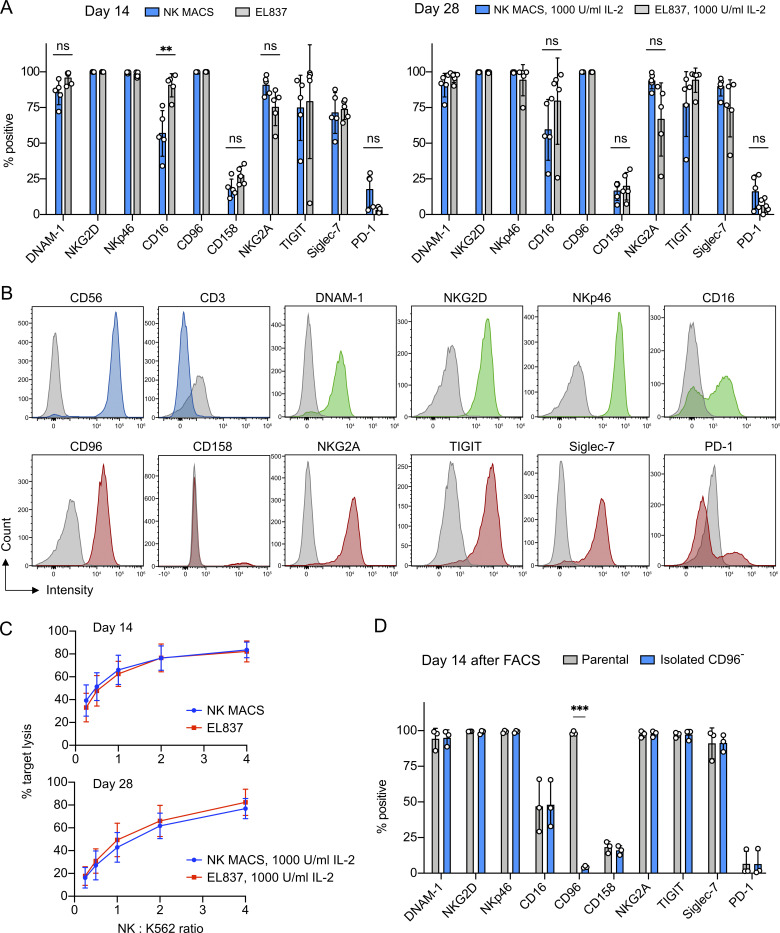
Figure 2.
The NK cells expanded in NK MACS and EL837 media showed comparable profiles of surface markers and cytotoxicity. (A) Profiles of surface markers from the indicated expansion days and conditions. Data are shown as mean ± SD of five donors (n = 5). (B) Representative flow cytometry plots of surface marker staining, using the cells from donor 3 on day 28 from NK MACS medium plus 1,000 U/ml IL-2. Antibody isotype staining is shown as gray peaks. (C) In vitro cytotoxicity against K562 cells from the indicated expansion days and conditions. (D) Surface markers of the CD96 KO cells that were isolated by FACS and reexpanded for 14 d. The unedited parental cells were processed by FACS and reexpanded for comparison. Data are shown as mean ± SD of three donors (n = 3). Two-tailed Welch’s unequal variances t test was used to test for statistical significance. ns, not significant; **, P ≤ 0.01; ***, P ≤ 0.001.

