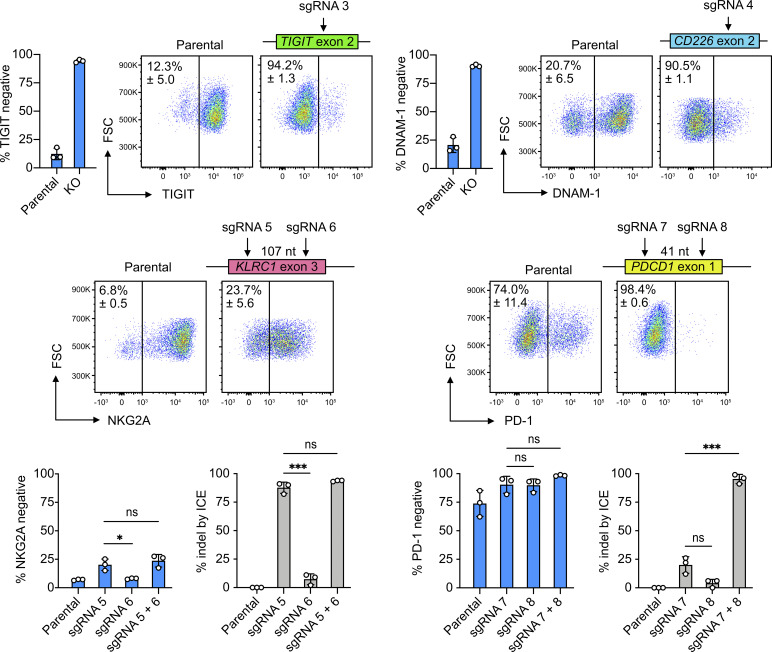
Figure 5.
Cas9 RNP nucleofection allowed rapid testing of sgRNA in cells. Six sgRNAs were designed to target TIGIT, CD226, KLRC1, and PDCD1 at the marked exons. Representative flow cytometry plots show the mean percentages of negative cells. In KLRC1 and PDCD1 KO, the distances between the two sgRNAs are labeled. ICE analysis was performed in KLRC1 and PDCD1 KO to reveal the discrepancy between DNA sequencing and flow cytometry readouts. Data are shown as mean ± SD of three donors (n = 3). Two-tailed Welch’s unequal variances t test was used to test for statistical significance. *, P ≤ 0.05; ***, P ≤ 0.001. FSC, forward scatter; ns, not significant.

