Figure 2.
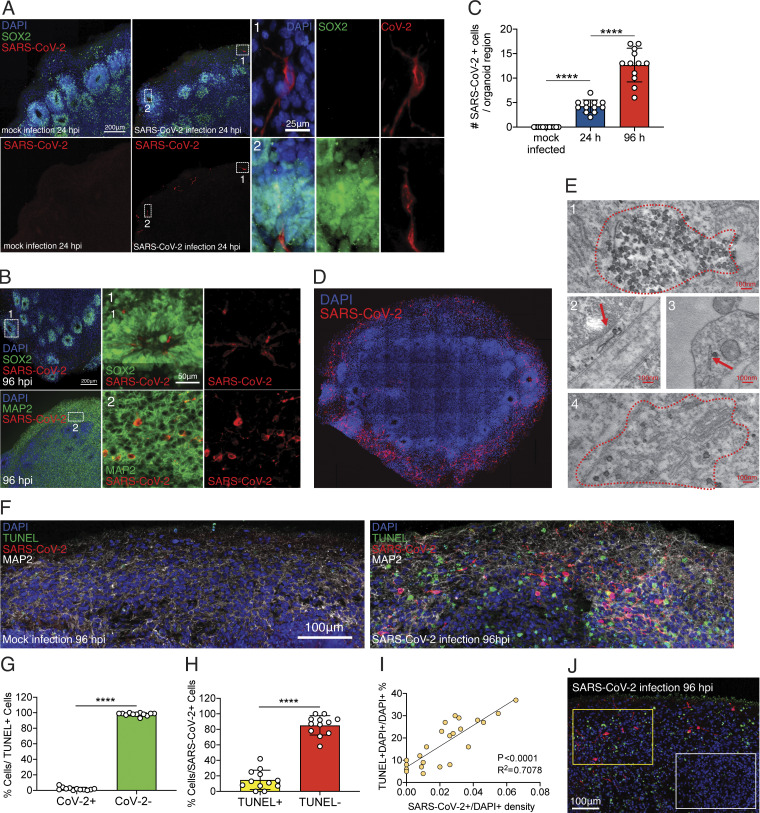
SARS-CoV-2 infects human brain organoids and induces cell death. Human brain organoids were infected with SARS-CoV-2 and collected 24 or 96 hpi to analyze for different cellular markers. (A) Images of brain organoids looking at SARS-CoV-2 infection (in red) 24 hpi (see Fig. S2 C for additional images). Scale bar = 200 µm for zoomed-out images and 25 µm for zoomed-in images. (B) Images of brain organoids looking at SARS-CoV-2 infection (in red) 96 hpi (see Fig. S2 D for additional images). Scale bar = 200 µm for zoomed-out images and 50 µm for zoomed-in images. (C) Quantification of SARS-CoV-2–positive cells in a single microscope image of cortical region of organoids (A and B). (D) Tiled image of 96-hpi organoid. (E) Electron microscopy image of SARS-CoV-2 viral particles in brain organoids (see Fig. S3 for uncropped and additional images). Scale bar = 100 nm. (F) Organoids were stained with TUNEL to evaluate cell death at 96 hpi. Scale bar = 100 µm. (G) Quantification of SARS-CoV-2 and TUNEL double-positive (yellow) or SARS-CoV-2–negative, TUNEL-positive (green) cells over total TUNEL-positive cells. (H) Quantification of SARS-CoV-2 and TUNEL double-positive (yellow) or SARS-CoV-2–positive, TUNEL-negative (red) cells over total SARS-CoV-2–positive cells. (I) Correlation between the frequency of TUNEL-positive cells and presence SARS-CoV-2 in different regions of the organoid. (J) Representative image of TUNEL and SARS-CoV-2 staining showing high-density SARS-CoV-2 region (yellow box) and low-density SARS-CoV-2 region (white box) in the same plane. Scale bar = 100 µm. All experiments were performed with unique organoid, n = 4 per condition, from the same culturing batch, with images from n = 12 cortical regions with two IPSC lines, and Student’s t test was performed (****, P < 0.0001). Experiments were performed twice independently for reproducibility.

