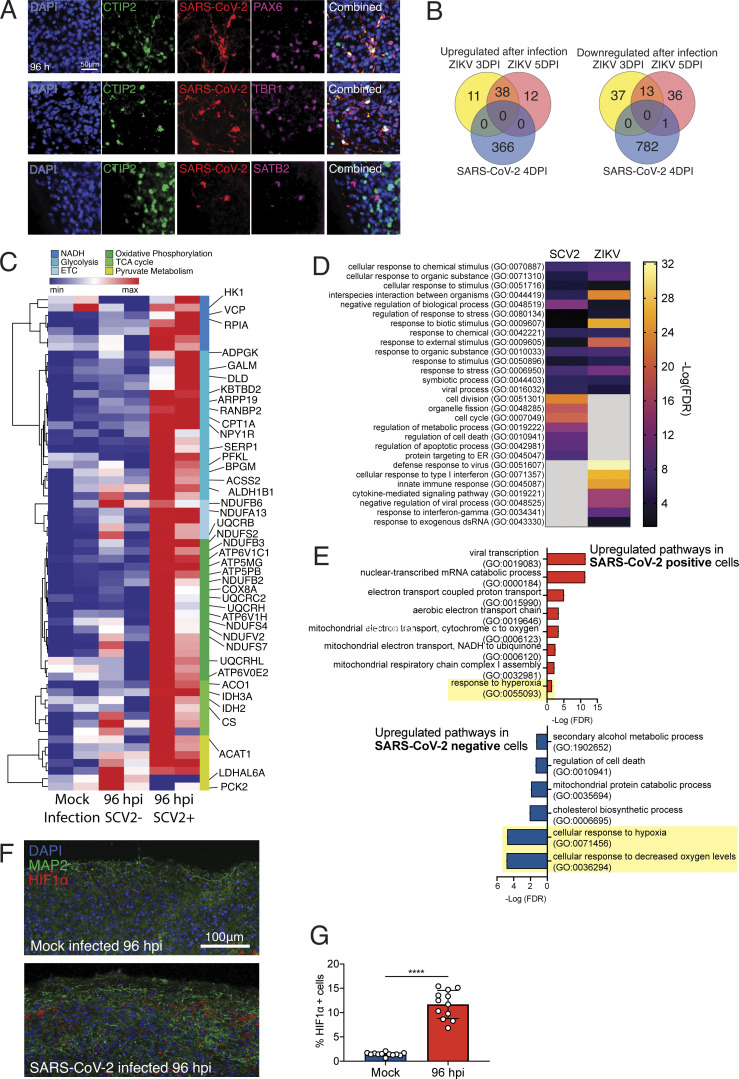
Figure 5.
Neuronal cells undergo a unique metabolic response to SARS-CoV-2 infections. Brain organoids were infected with SARS-CoV-2 and sequenced with 10× single-cell sequencing strategies. (A) Validation of neuronal subtypes using CTIP2, PAX6, and TBR1 antibodies for confocal imaging. Scale bar = 50 µm. (B) DEGs from brain organoids infected with ZIKV (Watanabe et al., 2017) were compared with DEGs from SARS-CoV-2–infected organoids. (D) Enriched gene ontology terms (http://www.geneontology.org) for up-regulated genes from B. (E) Enriched gene ontology terms in SARS-CoV-2–infected cells (top) and SARS-CoV-2–negative bystander cells from 96-hpi organoids (bottom). (C) Heatmap of genes from metabolic pathways. (F) HIF1A staining of brain organoids that were mock infected versus 96 hpi. Scale bar = 100 µm. (G) Quantification of HIF1A-positive cells in SARS-CoV-2–infected organoids. Single-cell RNA-seq was performed in duplicate with one IPSC line (Y6) for reproducibility. HIF1A staining was performed with unique organoid, n = 4 per condition, from the same culturing batch, with images from n = 12 cortical regions with two IPSC lines, and Student’s t test was performed (****, P < 0.0001). Experiments were performed twice for reproducibility.

