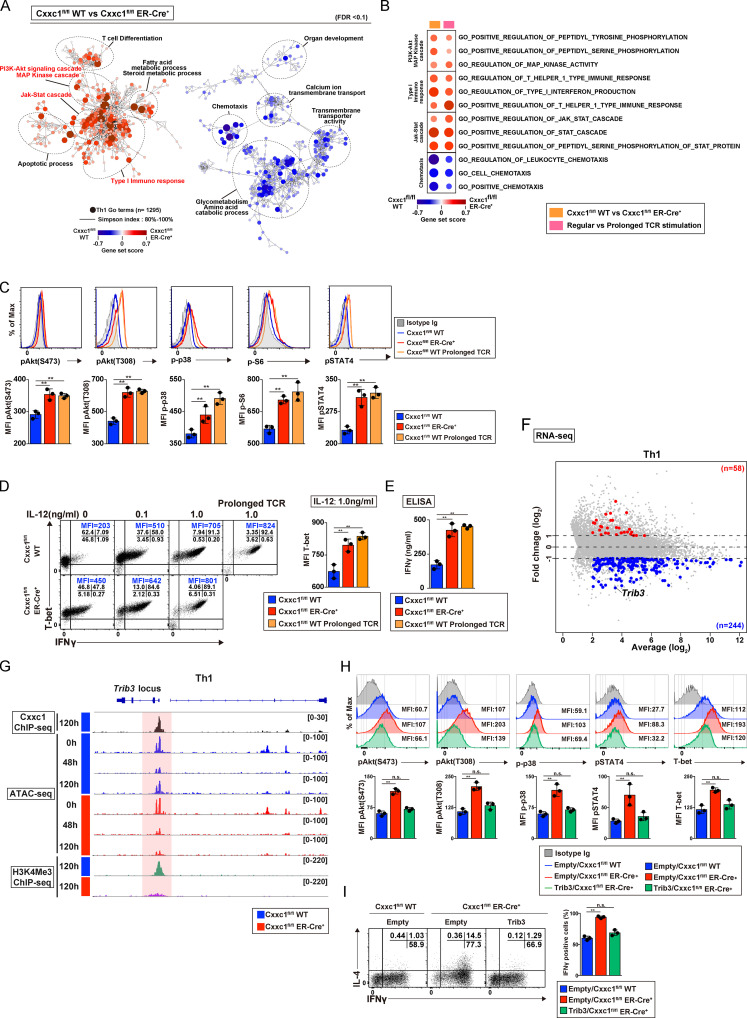
Figure 3.
Loss of Cxxc1 results in the enhanced production of Th1 cytokines via dysregulation of Trib3 expression in CD4+ T cells. (A) The pathways that were changed in Cxxc1-deficient Th1 cells compared with WT controls are shown. Dashed ellipses (added manually) indicate groups of similar GO terms. The node color indicates the gene set score. (B) The pathways changed in both Cxxc1-deficient Th1 cells and Th1 cells that received prolonged TCR/coreceptor stimulation are shown. (C) Representative staining profiles of phosphorylated (p)-AKT (T308), p-AKT (S473), p-p38, p-S6, and p-STAT4 in WT (with or without prolonged TCR/coreceptor stimulation) and Cxxc1-deficient Th1 cells are shown. The bar graphs show mean fluorescence intensity (MFI) with SDs from three independent experiments (**, P < 0.01). (D) Naive CD4+ T cells from the indicated mice were cultured under Th1 cell–inducing conditions with the indicated concentrations of IL-12. The cultured cells were restimulated with PMA plus ionomycin for 4 h. The intracellular staining profiles of IFNγ and T-bet were analyzed by flow cytometry. The bar graph shows the T-bet MFI with SDs from three independent experiments (**, P < 0.01). (E) The protein expression of IFNγ from WT Th1 cells, Cxxc1-deficient Th1 cells, or Th1 cells that received prolonged TCR/coreceptor stimulation. IFNγ secreted by Th1 cells stimulated with anti-TCRβ for 24 h was measured by ELISA. Data from three independent experiments are shown as the mean values and SDs (**, P < 0.01). (F) The MA plot depicts 10,298 genes in WT versus Cxxc1-deficient Th1 cells based on RNA-seq. The blue and red points indicate the Cxxc1-dependent group 4 genes that were down-regulated or up-regulated, respectively (greater than twofold) in the absence of Cxxc1. (G) A genome browser view of ChIP-seq signals in Th1 cells for 3xFlag-Cxxc1 and H3K4Me3 is shown for the Trib3 gene. Retroviral transduction of 3xFlag-Cxxc1 into Th1 cells was performed before the ChIP-seq analysis. ATAC-seq signals of naive (0 h) and differentiation process (48 h and 120 h) of WT or Cxxc1-deficient cells are also shown. (H) Flow cytometry of Cxxc1-deficient Th1 cells, which were transduced with retroviral vector encoding Trib3. Representative profiles of p-AKT (T308), p-AKT (S473), p-p38, p-STAT4, and T-bet expression are shown. Bar graphs show data from three independent experiments with mean values and SDs (**, P < 0.01). (I) Intracellular staining profiles of IFNγ and IL-4 in the indicated cells restimulated with PMA plus ionomycin for 4 h are shown. The bar graph shows the percentage of IFNγ-positive cells from three independent experiments with mean values and SDs (**, P < 0.01). n.s., not significant.

