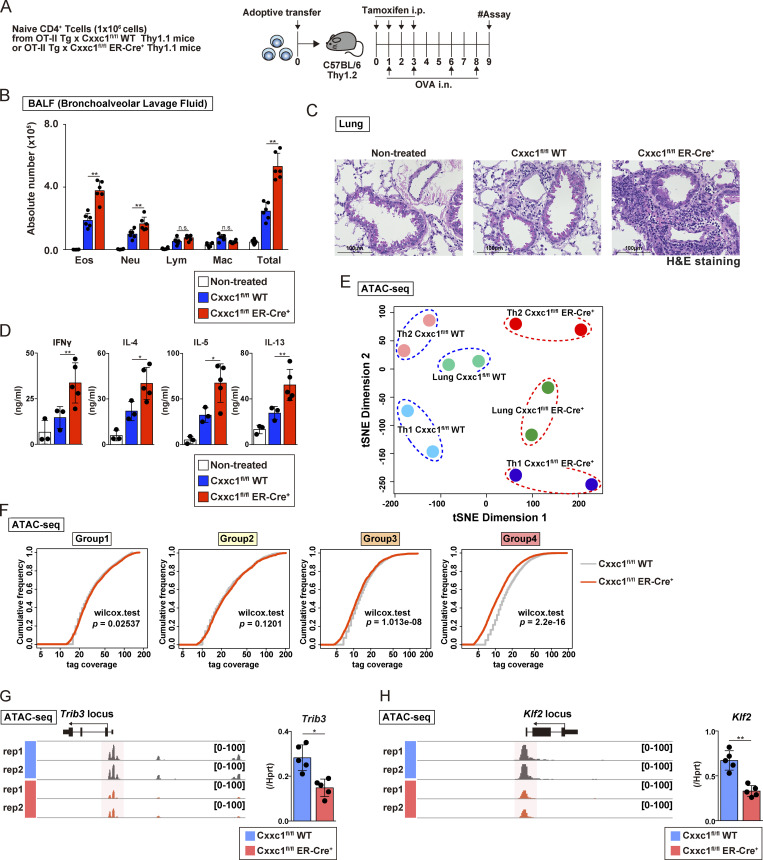
Figure 5.
Loss of the Cxxc1 enhances the airway inflammation in vivo. (A) An experimental protocol of allergic airway inflammation. In brief, the same numbers of naive CD4+ T cells from Cxxc1fl/fl (WT) or Cxxc1fl/fl ER-Cre+ (KO) mouse cells were transferred into C57BL/6 recipient mice that were treated with tamoxifen (by i.p. injection) and OVA (by i.n. injection). Mice that did not undergo cell transfer were used as controls. (B) The cell numbers of eosinophils (Eos), neutrophils (Neu), lymphocytes (Lym), and macrophages (Mac) in the BAL fluid are shown as the mean values with SDs (nontreated, n = 5; Cxxc1fl/fl [WT], n = 6; Cxxc1fl/fl [WT] ER-Cre+, n = 6; *, P < 0.05). (C) Images of H&E-stained lung specimens. Scale bars, 1 mm. (D) The indicated cytokines in the BAL fluid were measured by ELISA (nontreated, n = 3; Cxxc1fl/fl [WT], n = 3; Cxxc1fl/fl ER-Cre+, n = 6; *, P < 0.05; **, P < 0.01). (E) t-SNE plot visualization of Cxxc1fl/fl WT or Cxxc1-deficient (Cxxc1fl/fl ER-Cre+) cells based on ATAC-seq. Antigen-specific CD4+ T cells collected from the inflamed lung were referred to as lung Cxxc1fl/fl WT or Cxxc1fl/fl ER-Cre+. Data of Th1 and Th2 cells generated in vitro are adapted from Fig. 2 A and are also shown. (F) Cumulative distribution function plots of the normalized tag counts in ATAC-seq peaks in groups 1–4 are shown for Cxxc1fl/fl WT and Cxxc1-deficient (Cxxc1fl/fl ER-Cre+) cells. In each group, the P value was calculated by the Wilcoxon rank-sum test. (G and H) A genome browser view of the ATAC-seq signals in the indicated gene locus is shown (left). The mRNA expression levels in WT or Cxxc1-deficient cells were measured by qPCR (right). n.s, not significant.

