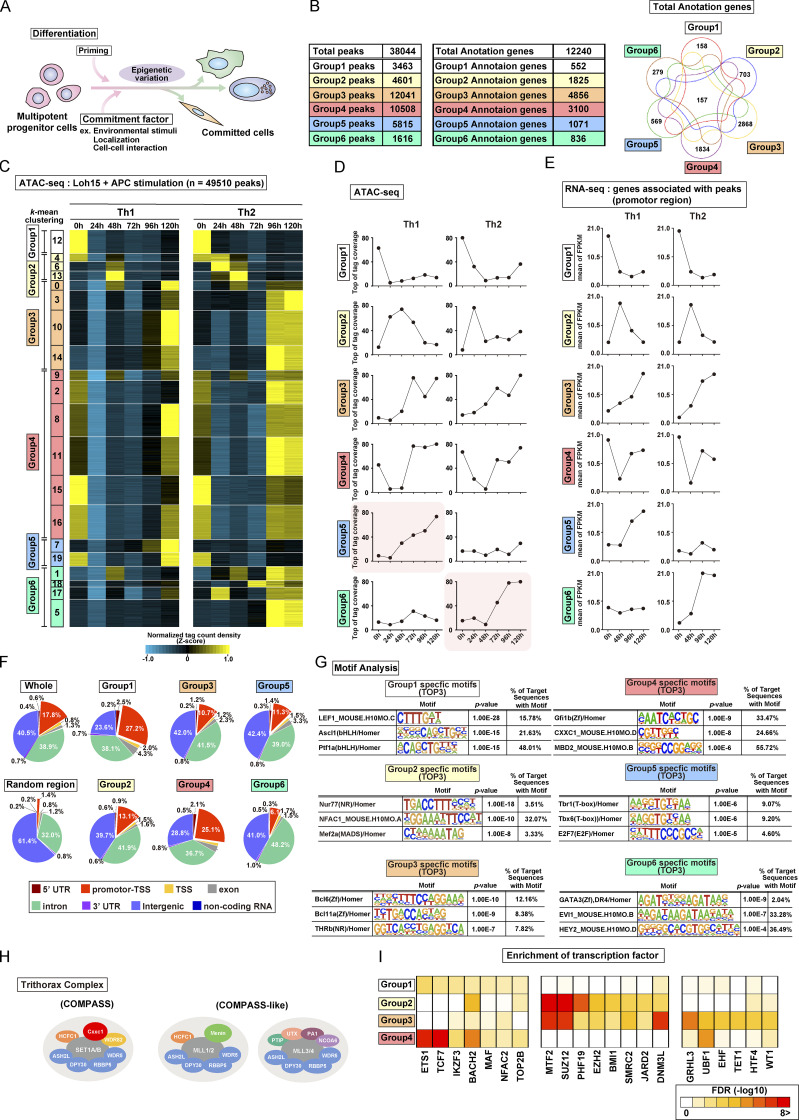
Figure S1.
TCR/coreceptor signaling alters chromatin accessibility landscapes in naive CD4 T cells stimulated with antigenic peptide and APCs (related to Fig. 1). (A) A schematic illustration of differentiation from the multipotent progenitor cells to committed cells. The differentiation is regulated by priming signals and commitment factors including environmental stimuli, both of which are critical for the induction of epigenetic variation. (B) Th1 and Th2 cells were generated using plate-bound anti-TCRβ and a soluble anti-CD28 antibody stimulation system. The numbers of groups 1–6 regions (left) and groups 1–6 genes (middle) are shown. All genes that had at least one ATAC-seq peak in the promoter region were classified into the corresponding six groups while allowing overlap (right). (C–E) Th1 and Th2 cells were generated using the DO11.10 TCR Tg system; (i.e., naive CD4+ T cells were stimulated with OVA peptide presented by APCs (also see Materials and methods). The heatmap demonstrates the level of chromatin accessibility at 49,510 regulatory regions measured by ATAC-seq for naive cells (0 h) and the process of differentiation induced by Loh15 peptide plus APC stimulation (24 h, 48 h, 72 h, 96 h, and 120 h; C). Accessible regions were organized in groups by k-means clustering (k = 20). Clusters were assembled into six metaclusters (groups 1–6), depending on their accessibility patterns. The average tag count of each peak of ATAC-seq for differentiating Th1 or Th2 cells (D). The RNA expression of genes whose promoters (i.e., from 5 kb upstream to 2 kb downstream of the transcription start site) were associated with groups 1–6 regions (E). (F) The pie charts display the annotation of groups 1–6 regions. The results obtained with random regions of the genome and pooled data of groups 1–6 are shown as Random and Whole, respectively. (G) The top three motifs enriched in Fig. 1 F are shown with the DNA sequence, P value, and percentage. (H) A schematic representation of the Trithorax complex. Cxxc1 forms the Compass complex with SET1A/B that methylates H3K4 (left). MLL1/2-containing (middle) and MLL3/4-containing (right) Compass-like complexes are also shown. (I) Potential proteins binding to the promoters of the groups 1 (left), 2 (middle), and 3 (right) genes were predicted on the basis of transcription factor enrichment analysis. FPKM, fragments per kilobase of exon model per million mapped reads; UTR, untranslated region.

