
Figure 2. Loss of Chi3l1 mildly shifts glial activation.
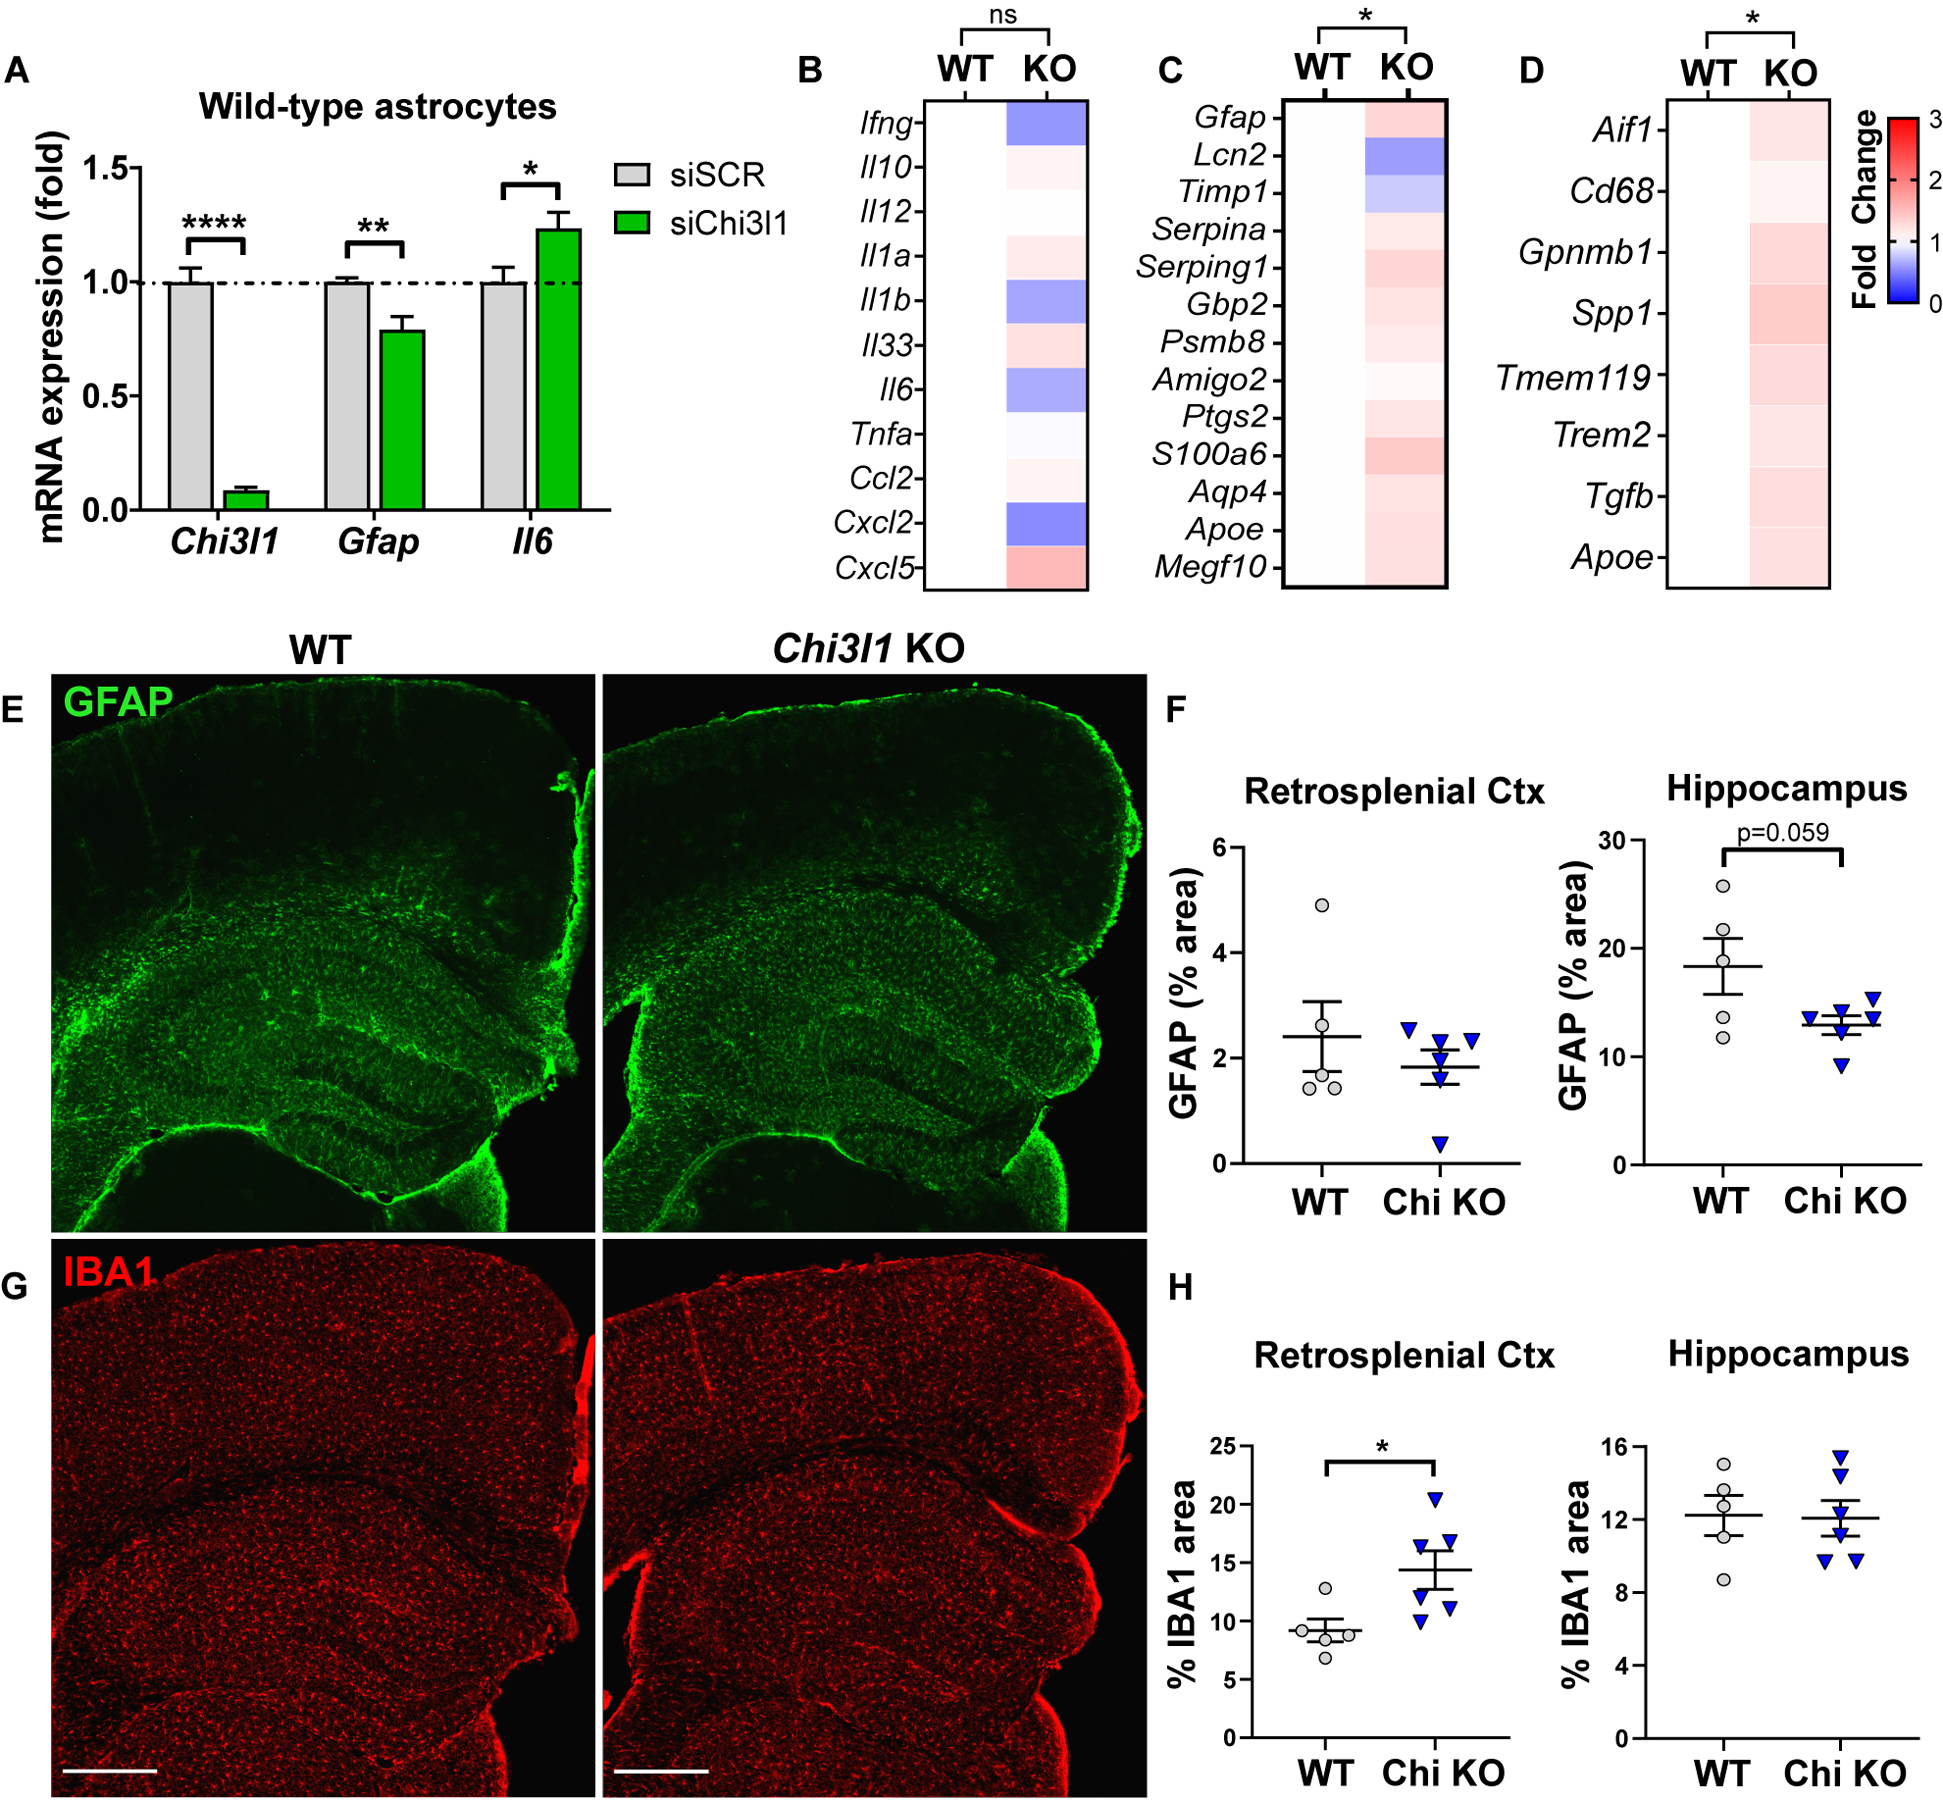
A. qPCR gene expression from primary astrocytes transfected with control (siScr) or Chi3l1 (siChi3l1) siRNA. n = 6–10 replicates from 3 independent experiments.
B–D. Cytokine and chemokine (B), astrocyte activation marker (C) or microglia activation marker (D) expression from fluidigm qPCR of 2–5mo Chi3l1−/− and WT control mouse cortex 6 hours after i.p. PBS. Mean of 6 mice/group normalized to WT. Two-way ANOVA with Tukey correction for multiple comparisons.
E–H. Representative images depicting GFAP (astrocyte) staining (E) and associated quantification (F) or IBA1 (microglia) staining (G) and associated quantification (H) in Chi3l1−/− and WT control mice. Scale bar = 400μm
All data represent mean +/− SEM. *p < 0.05, **p < 0.01, ****p < 0.0001 by two-tailed students t-test with Holm-Sidak correction for multiple comparisons when appropriate.