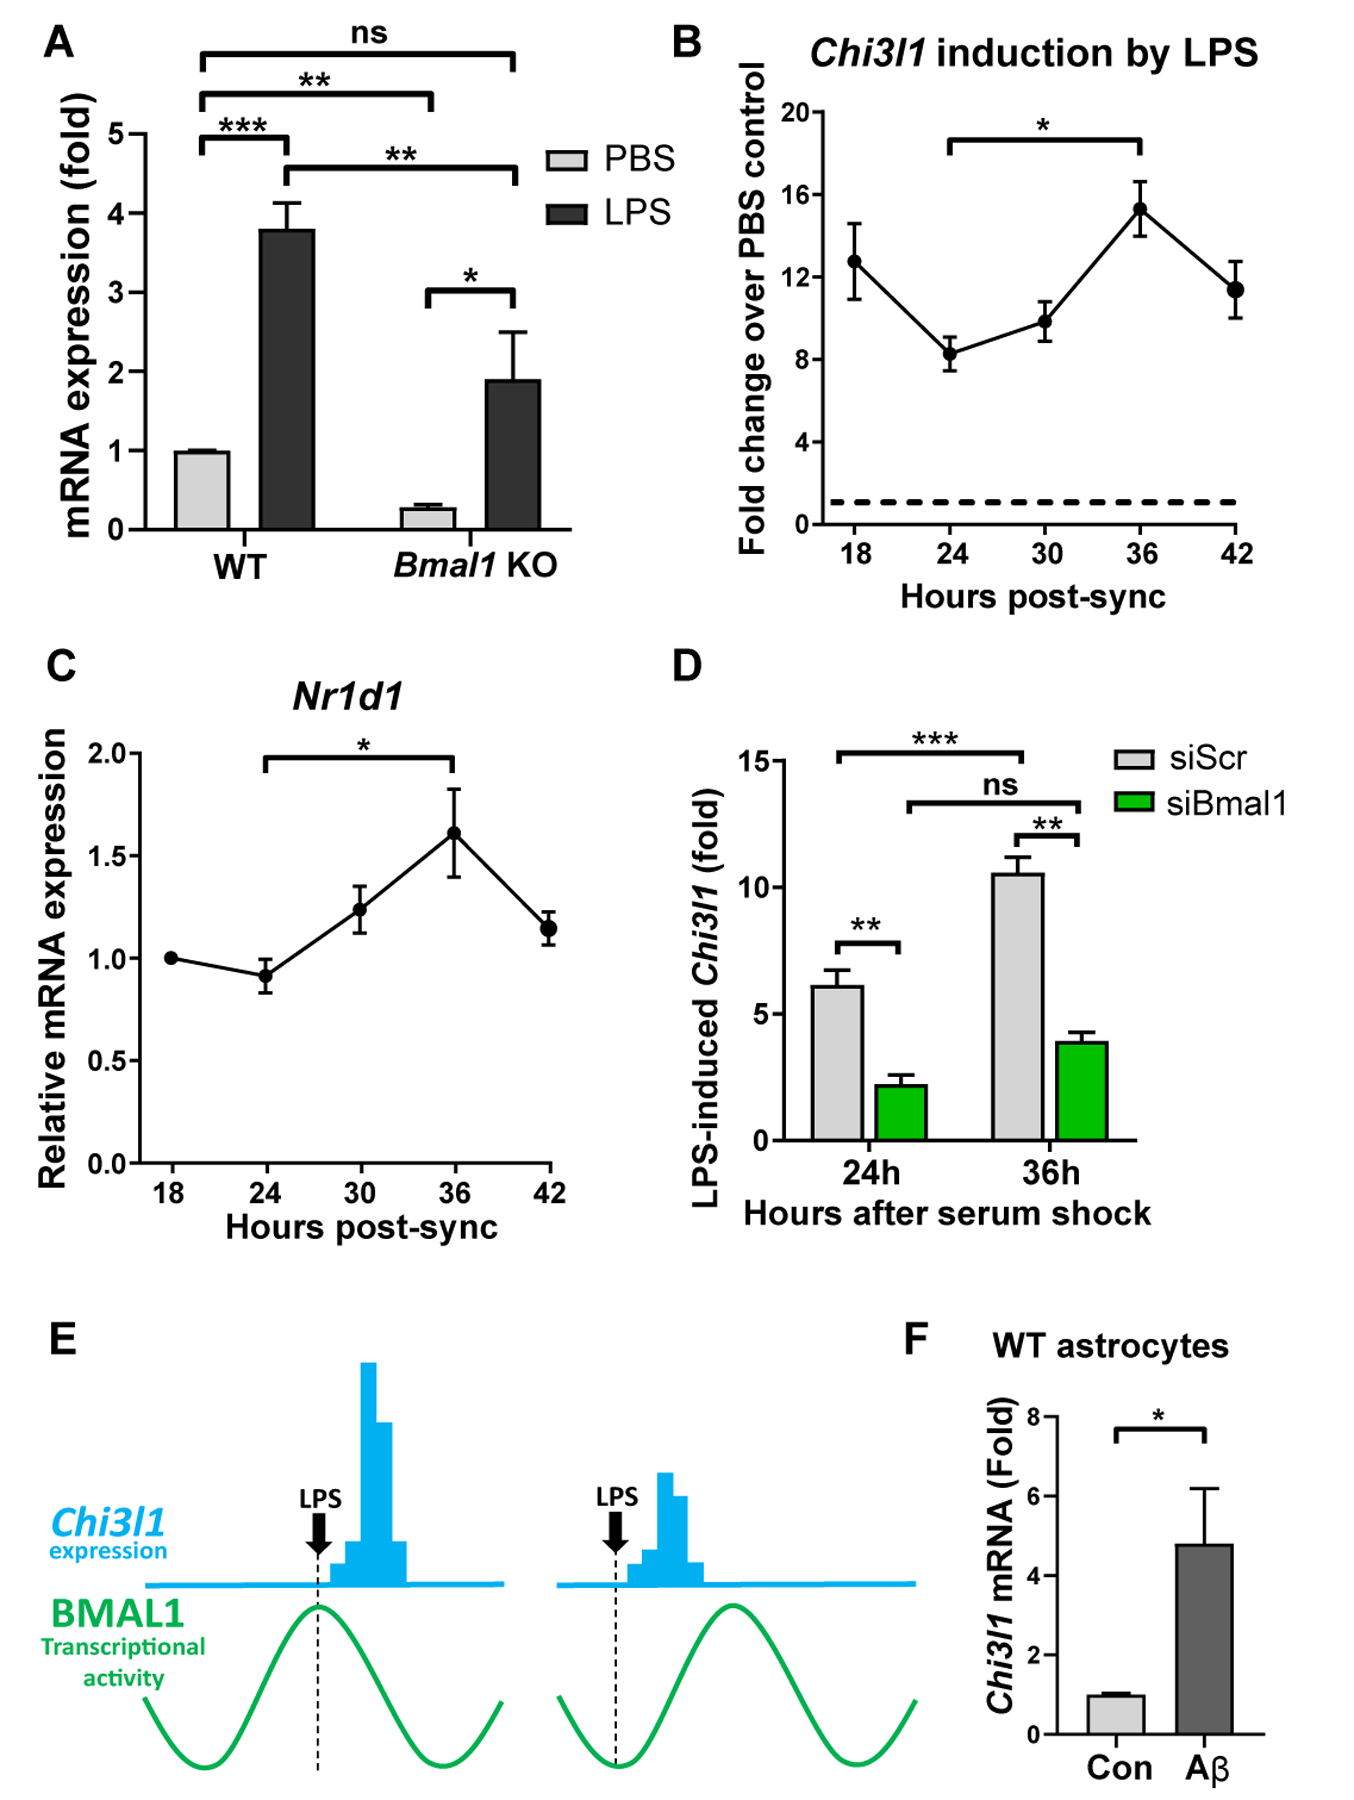
Figure 7. Chi3l1 is induced during inflammation in a Bmal1 dependent manner.

A. qPCR showing gene expression from WT and Bmal1 KO primary astrocytes +/− 500ng/ml LPS for 6 hours. n = 5 independent experiments.
B–C. qPCR showing LPS-induced Chi3l1 gene expression (B) or expression of Nr1d1 (C) in WT primary astrocytes synchronized with high serum shock. Cells were treated with 500 ng/ml LPS (B) or PBS (C) at designated timepoints and collected 3 hours after treatment. n = 6–9 replicates from 2–3 independent experiments per timepoint. Data normalized to basal Chi3l1 expression in PBS control cells (depicted by dashed line) (B) or expression at 18 hours (C). Main effect p = 0.0150 (B), p = 0.0013 (C). Multiple comparison tests depicted on graphs.
D. qPCR showing LPS-induced Chi3l1 expression in WT primary astrocytes after transfection with control (siSCR) or Bmal1 (siBmal1) siRNA, treated with 500ng/ml LPS at 24h or 36h post-synchronization (as in (B)). n = 3 replicates/genotype/timepoint.
E. Diagram depicting hypothesis that induction of Chi3l1 expression (blue) is dependent on the circadian phase of BMAL1 transcriptional activity (green curve).
F. qPCR showing gene expression from WT primary astrocytes +/− 10μM Aβ fibrils for 48–72 hours. n = 6 replicates from 2 independent experiments.
All data represent mean +/− SEM. *p < 0.05, **p < 0.01, ***p < 0.001. Analyzed by two-way ANOVA (A, D) or one-way ANOVA (B, C) with Tukey correction for multiple comparisons or two-tailed students t-test (F).
