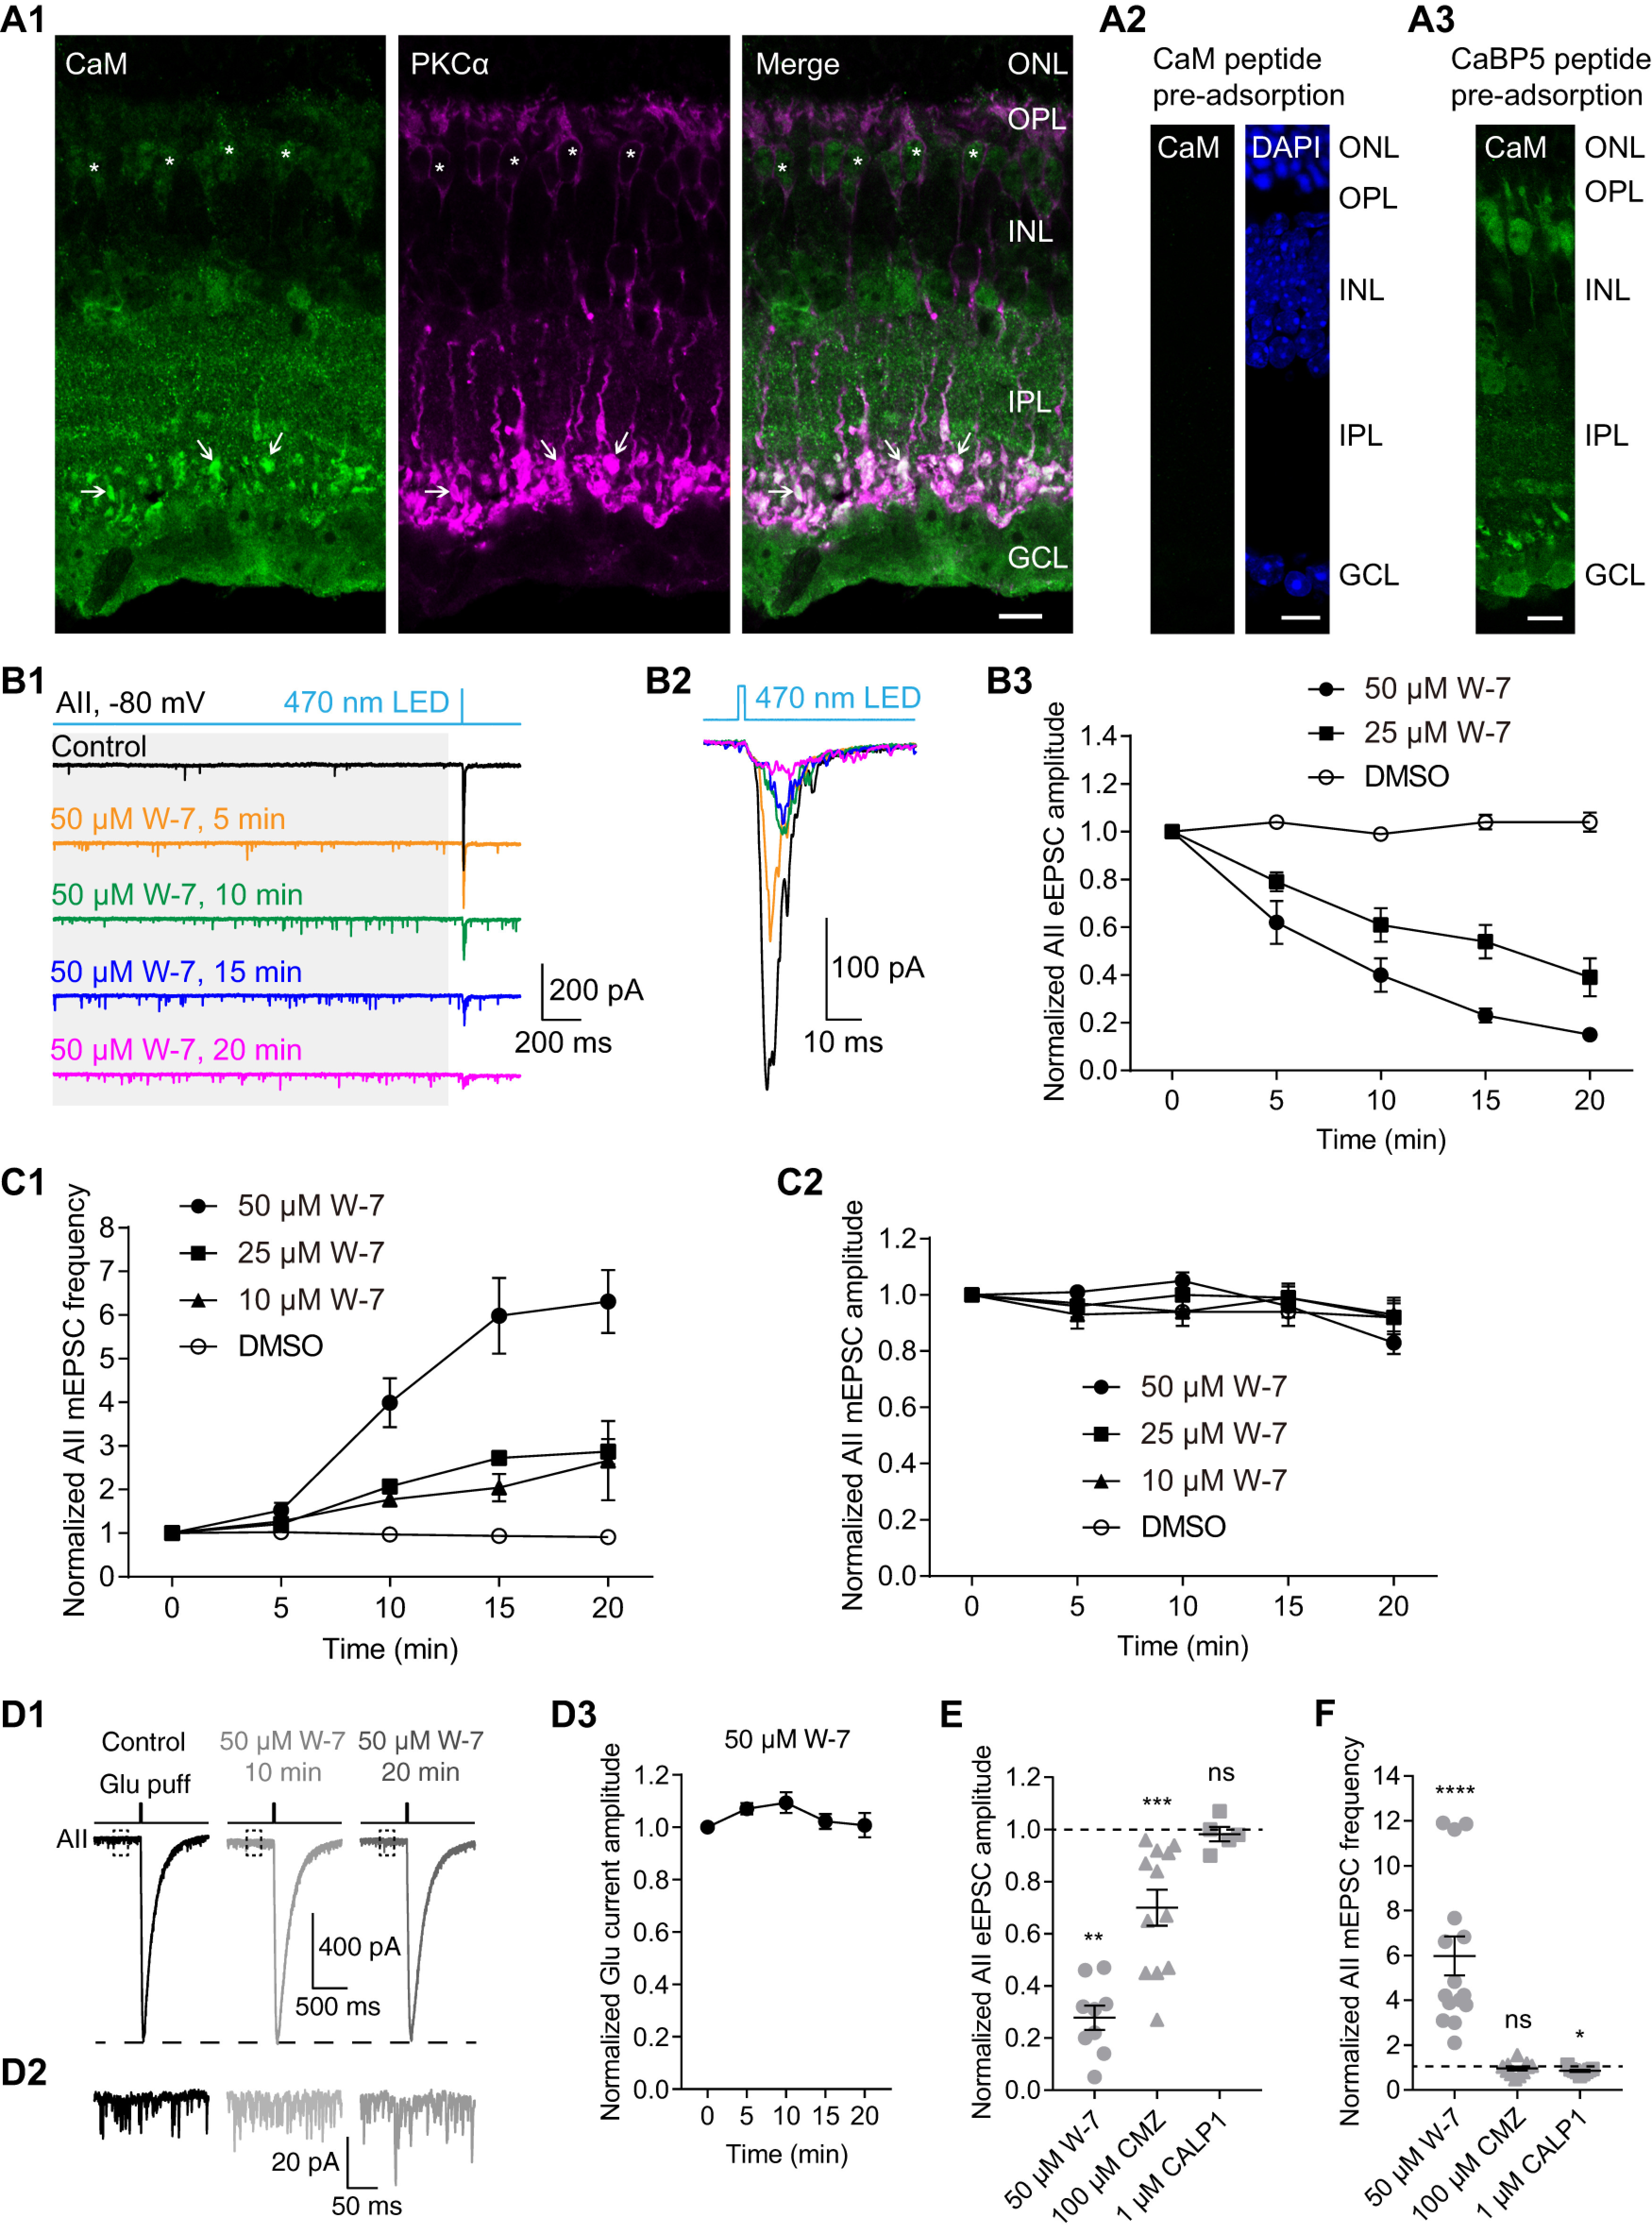
Figure 2.

CaM bidirectionally regulates evoked and spontaneous neurotransmitter release from RBs. A1, Confocal images showing immunofluorescence double labeling of CaM (green) and PKCα (magenta), a specific cell marker of RBs, in a frozen retinal slice. In the merged image (green + magenta), expression of CaM could be clearly seen in the axon terminals (arrow) and somata (asterisk) of RBs. Scale bar: 10 μm. ONL: outer nuclear layer; OPL: outer plexiform layer; INL: inner nuclear layer; IPL: inner plexiform layer; GCL: ganglion cell layer. A2, No labeling was observed in the negative control where the anti-CaM antibody was preincubated with the CaM immunopeptide. DAPI staining showed the three major cell body layers in the retina. Scale bar: 10 μm. A3, Preadsorption of the anti-CaM antibody with the CaBP5 immunopeptide did not change the staining pattern for CaM. Scale bar: 10 μm. B1, Two-millisecond flashes of 470-nm LED were presented to stimulate ChR2 in Pcp2-cre::Ai32 mice with L-AP4 and ACET in the bath to block synaptic transmission between photoreceptors and bipolar cells; all the inhibitory connections were also blocked. The evoked responses (eEPSCs) and the small responses induced by spontaneous release before light onset (mEPSCs; see gray background area) in AII amacrine cells were recorded. Vhold = −80 mV. Individual traces showed that the CaM antagonist, W-7 (50 μm) strongly increased mEPSC frequency and reduced eEPSC amplitude. B2, Average traces of eEPSCs recorded in the same AII in B1. B3, Statistics of the effects of 25 μm (n = 6) and 50 μm (n = 9) W-7 on eEPSC amplitude. The amplitudes were normalized to the amplitude at time 0 in each cell before averaging across cells. C1, Statistics of the effects of 10 μm (n = 8), 25 μm (n = 13), and 50 μm (n = 15) W-7 on mEPSC frequency. The frequencies were normalized to the frequency at time 0 in each cell before averaging across cells. C2, Statistics of the effects of 10 μm (n = 8), 25 μm (n = 13), and 50 μm (n = 15) W-7 on mEPSC amplitude. The amplitudes were normalized to the amplitude at time 0 in each cell before averaging across cells. D1, Individual traces showing that W-7 (50 μm) had no inhibitory effect on AMPA receptor-mediated currents recorded in an AII evoked by glutamate (1 mm) applied onto the AII dendrites at the border of the IPL and GCL. Vhold = −80 mV. D2, Magnification of the traces in the dashed line frames of D1, showing increase of mEPSC frequency by W-7. D3, Statistics of the effects of 50 μm W-7 (n = 7) on the amplitude of glutamate-evoked currents. The amplitudes were normalized to the amplitude at time 0 in each cell before averaging across cells. E, Summary data showing the effects of 50 μm W-7 (circles), 100 μm CMZ (triangles), another CaM antagonist, and 1 μm CALP1 (squares), a CaM agonist, on eEPSC amplitude after bath application for 15 min. The amplitudes were normalized to the amplitude at time 0 in each cell before averaging across cells. The data were also illustrated as mean ± SEM. Wilcoxon signed-rank tests were used (control vs W-7, n = 9, p = 0.0039; control vs CMZ, n = 12, p = 0.0005; control vs CALP1, n = 5, p = 0.6250); **p < 0.01, ***p < 0.001; ns: not statistically different. Note that CMZ reduced eEPSC amplitude too, but CALP1 did not enhance eEPSC amplitude under control conditions. F, Summary data showing the effects of 50 μm W-7 (circles), 100 μm CMZ (triangles), and 1 μm CALP1 (squares) on mEPSC frequency. The frequencies were normalized to the frequency at time 0 in each cell before averaging across cells. The data were also illustrated as mean ± SEM. Wilcoxon signed-rank tests were used (control vs W-7, n = 15, p < 0.0001; control vs CMZ, n = 12, p = 0.6377; control vs CALP1, n = 9, p = 0.0273); *p < 0.05, ****p < 0.0001; ns: not statistically different. Note that CMZ did not change the mEPSC frequency, but activation of CaM by CALP1 slightly reduced mEPSC frequency.
