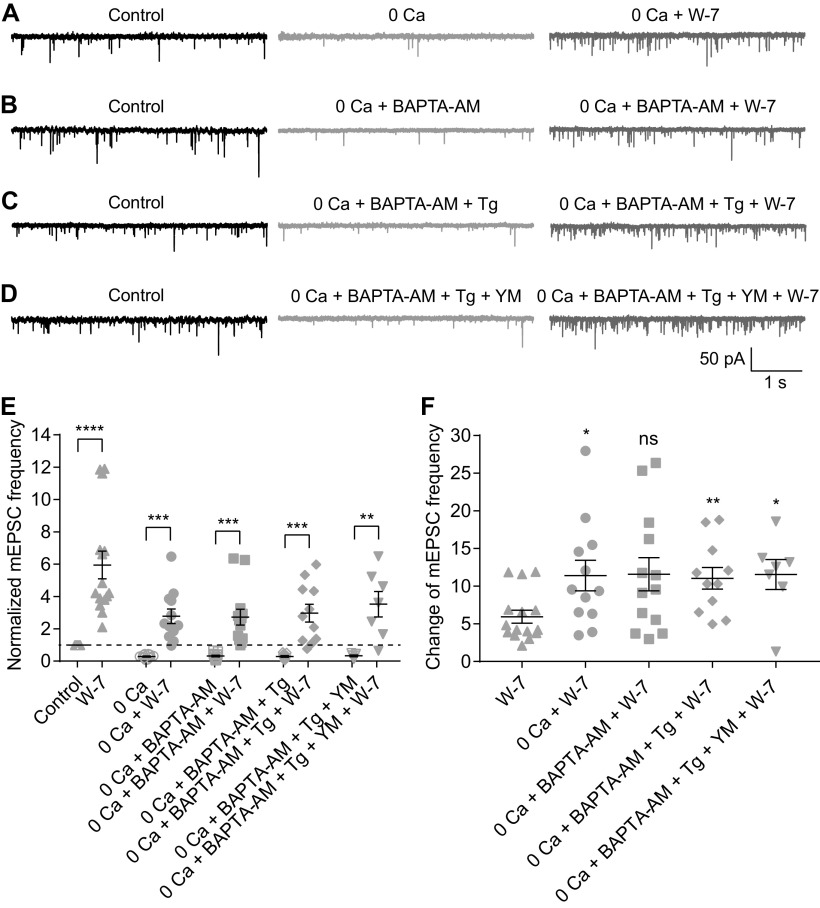
Figure 5.
Both Ca2+-dependent and Ca2+-independent spontaneous release are enhanced, but to different extents, when CaM is inhibited. A–D, Representative traces showing mEPSCs recorded in AIIs under four experimental conditions in different combinations of removal of extracellular calcium (0 Ca), 10 μm BAPTA-AM, 1 μm Tg, and 1 μm YM-58483 (YM). The traces showing mEPSCs after bath application of 50 μm W-7 for 15 min under each condition were also presented. E, Summary data for AII mEPSC frequency under four experimental conditions in A–D. The data under control and W-7 conditions (adapted from Fig. 2C1, empty and full up triangles, respectively) were also presented for direct comparison. The frequencies were normalized to the frequency under control condition in each cell before averaging across cells. The data were also illustrated as mean ± SEM. Paired Student’s t tests were used (0 Ca vs 0 Ca + W-7, n = 12, p = 0.0001; 0 Ca + BAPTA-AM vs 0 Ca + BAPTA-AM + W-7, n = 13, p = 0.0002; 0 Ca + BAPTA-AM + Tg vs 0 Ca + BAPTA-AM + Tg + W-7, n = 11, p = 0.0004; 0 Ca + BAPTA-AM + Tg + YM vs 0 Ca + BAPTA-AM + Tg + YM + W-7, n = 7, p = 0.0062) except for comparison of control and W-7 data by Wilcoxon signed-rank test (n = 15, p < 0.0001); **p < 0.01, ***p < 0.001, ****p < 0.0001. F, Summary data for the relative effect of W-7 on AII mEPSC frequency under control and four experimental conditions. The change in each cell was calculated as the ratio of mEPSC frequencies before and 15 min after application of W-7. The data were also illustrated as mean ± SEM. Mann–Whitney tests were used (W-7 vs 0 Ca + W-7, p = 0.0214; W-7 vs 0 Ca + BAPTA-AM + W-7, p = 0.0954; W-7 vs 0 Ca + BAPTA-AM + Tg + W-7, p = 0.0045; W-7 vs 0 Ca + BAPTA-AM + Tg + YM + W-7, p = 0.0262); *p < 0.05, **p < 0.01; ns: not statistically different.

