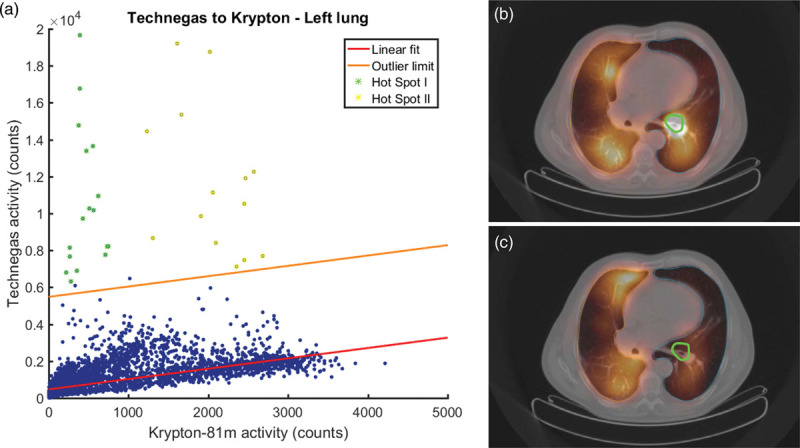
Fig. 4.

An example of a patient with a severe hot spot in the left lung for Technegas in an attenuation and scatter corrected scan using MEGP collimators. (a) The scatter plot corresponding to the left lung showing 33 outliers. The red line indicates the linear fit, while the orange line indicates the outlier limit; all points above the outlier limit are considered to be statistically significant outliers. (b) An axial slice of the corresponding Technegas ventilation image and (c) the same slice in the corresponding 81mKrypton ventilation image. Note the presence of a severe hot spot in the center of the left lung in the Technegas scan outlined in the ROI marked in green (b). The ROI is an autocontour based on 40% of the maximum Technegas intensity. Points in this hot spot ROI are indicated in green in the scatterplot (a). The other hot spot, indicated in the scatter plot in yellow, is not shown in the axial slices. In (b) and (c), the right lung is outlined in orange and the left lung is outlined in blue. MEGP, medium energy general purpose.
