
Figure 4.
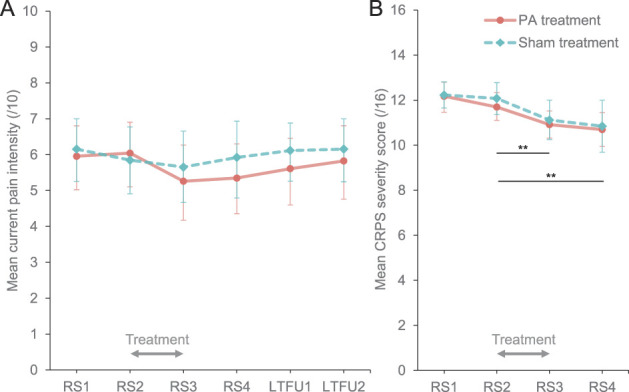
Primary outcomes (intention-to-treat analysis). Mean (BCa 95% CI) current pain intensity (A) and CRPS severity scores (B) in prism adaptation (PA; orange circles) and sham treatment (blue diamonds) groups in each time point. LTFU1 and LTFU2, long-term follow-ups 1 and 2; RS1, RS2, RS3, and RS4, research sessions 1, 2, 3, and 4. Gray arrows indicate the treatment period. **Significant decrease in CRPS severity between RS2 and RS3, maintained at RS4, regardless of treatment, Psadj < 0.01. BCa 95% CI, bootstrapped bias-corrected and accelerated 95% confidence interval, CRPS, complex regional pain syndrome; PA, prism adaptation.