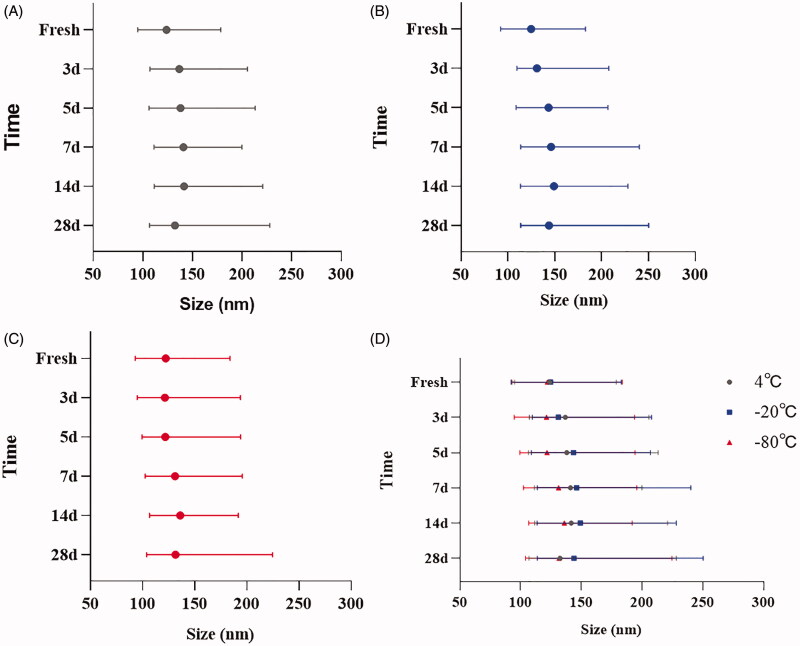
Figure 3.
Cumulative size distribution of sEVs under different storage conditions. (A) Change of size distribution of sEVs stored at 4 °C. (B) Change of size distribution of sEVs stored at −20 °C. (C) Change of size distribution of sEVs stored at −80 °C. (D) Summary of change of size distribution of sEVs stored at different conditions. Bar shows the size range from D10 to D90, symbol shows the D50.

