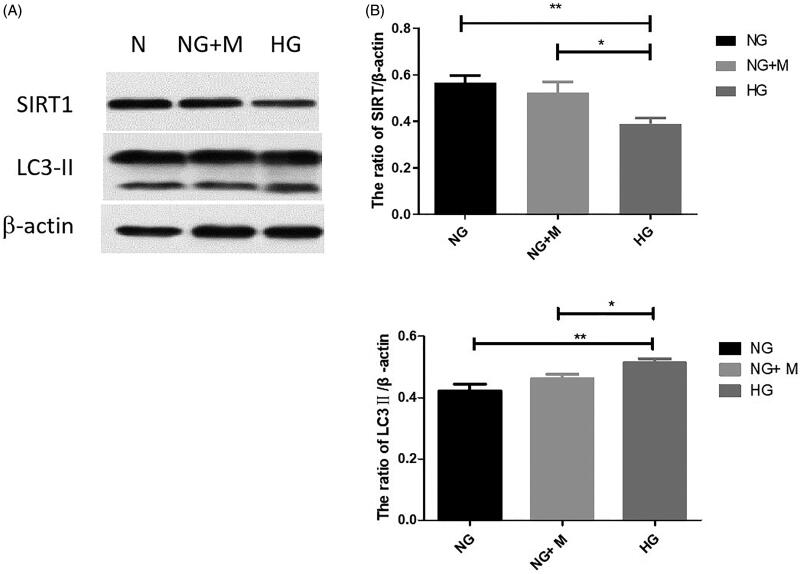
Figure 4.
Expression of SIRT1 and LC3-II in immortalized mouse podocytes under normal glucose (NG), high glucose (HG), and mannitol isotonic (NG + M) conditions. (A) Representative western blotting bands corresponding to SIRT1, LC3-II, and β-actin. The expression trend of LC3II is indicated by the lower one of two bands in Western Blot, the upper band demonstrates the expression of LC3I. (B) Quantification of SIRT1 expression; (C) Quantification of LC3-II expression. Values are presented as the mean ± SD. n = 3. *p < 0.05; **p < 0.01.

