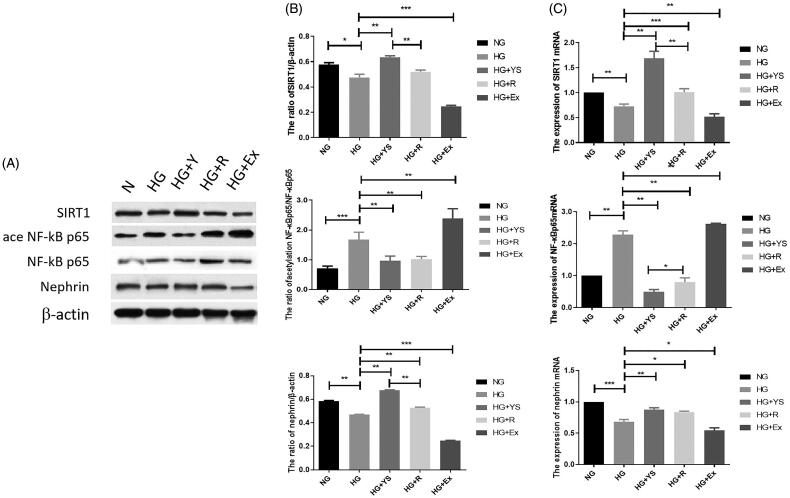
Figure 7.
Expression of SIRT1, acetylated NF-κB p65, and nephrin under different culture conditions. NG = normal glucose, HG = high glucose, YS = Yishen capsule, R = resveratrol, and Ex = Ex-527. (A) Representative western blotting bands corresponding to SIRT1, acetylated NF-κB p65, and nephrin. (B) Quantification of protein levels of SIRT1, acetylated NF-kB p65, and nephrin. (C) Quantification of mRNA levels of genes. Values are presented as the mean ± SD. n = 3. *p < 0.05; **p < 0.01. ***p < 0.001.

