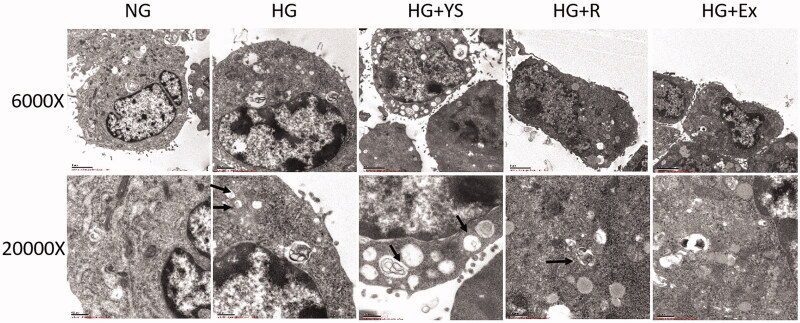
Figure 9.
Representative transmission electron microscopic (TEM) images of podocytes under different culture conditions. NG = normal glucose, HG = high glucose, YS = Yishen capsule, R = resveratrol, and Ex = Ex-527. More autophagosomes are present in the HG treatment groups (i.e. HG, HG + Y, HG + R, and HG + E). Autophagosomes and vacuoles are increased in HG + Y and HG + R compared to that in the HG + E group. Images were captured at 6000 × (upper) and 20000 × (lower) magnification, respectively, with a transmission electron microscope. Black arrows indicate autophagosomes.

