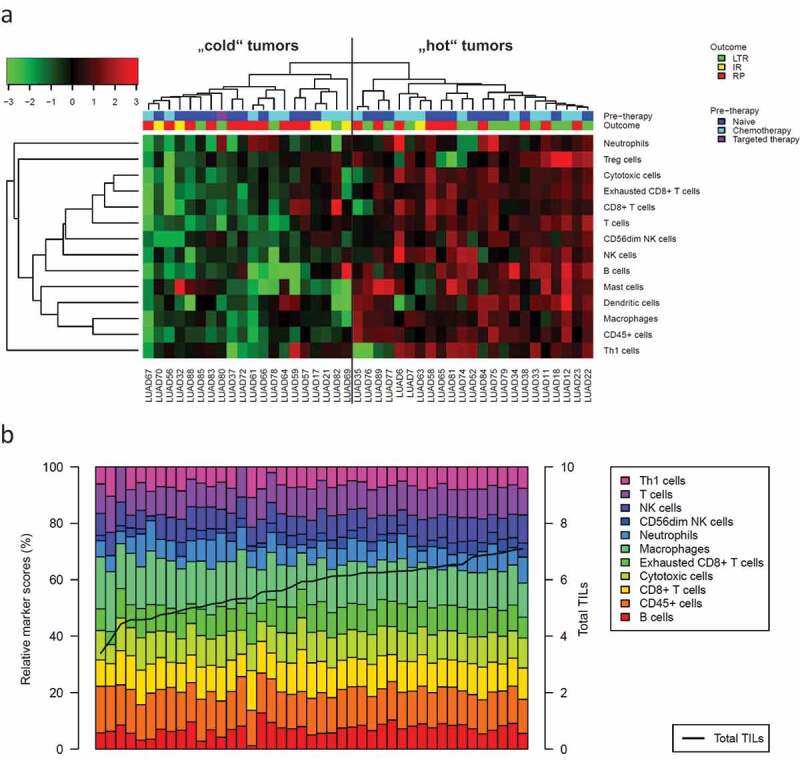
Figure 2.

Composition of the tumor immune microenvironment in the study cohort of metastatic adenocarcinoma
The abundance of 14 specific immune cell populations and total TILs was estimated from mRNA expression profiles. (a) Hierarchical clustering separated n = 23 immunological “hot” tumors from n = 20 immunological “cold” tumors. Response to ICB (LTR/IR/RP) was significantly different in these clusters (p = .046) with a higher percentage of LTR in the cluster of “hot” tumors (52%) compared to the cluster of “cold” tumors (20%). (b) Barplot showing the contribution of specific immune cell types (in %, bars) to total TILs (logarithmic score, line). LTR = long-term responder, IR = intermediate responder, RP = rapid progressor.
