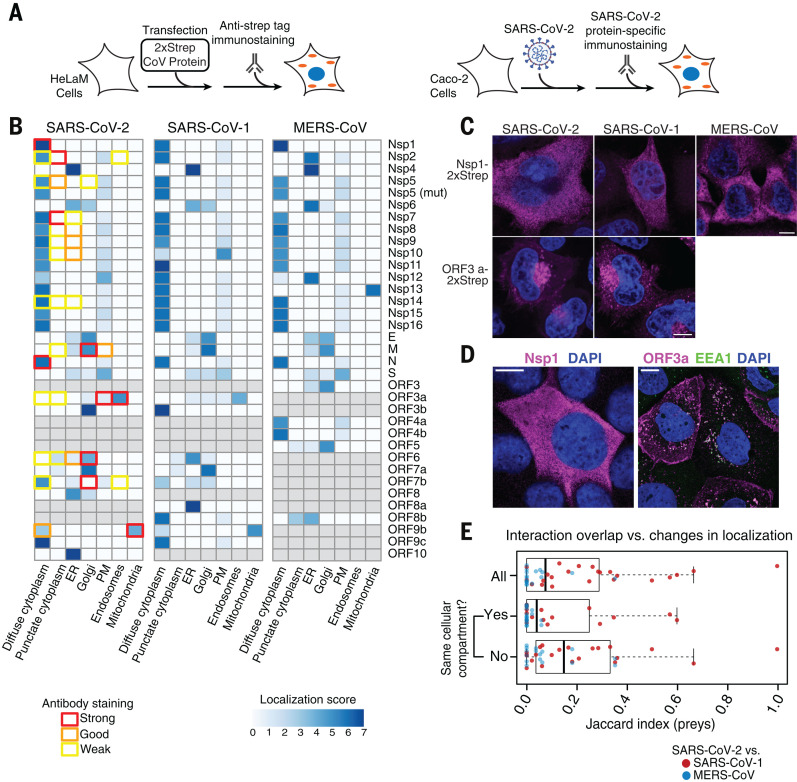
Fig. 2. Coronavirus protein localization analysis.
(A) Overview of experimental design to determine localization of Strep-tagged SARS-CoV-2, SARS-CoV-1, and MERS-CoV proteins in HeLaM cells (left) or of viral proteins upon SARS-CoV-2 infection in Caco-2 cells (right). (B) Relative localization for all coronavirus proteins across viruses expressed individually (blue color bar) or in SARS-CoV-2–infected cells (colored box outlines). (C and D) Localization of Nsp1 and ORF3a expressed individually (C) or during infection (D); for representative images of all tagged constructs and viral proteins imaged during infection, see figs. S8 to S14 and fig. S15, respectively. Scale bars, 10 μm. (E) Prey overlap per bait measured as Jaccard index comparing SARS-CoV-2 versus SARS-CoV-1 (red dots) and SARS-CoV-2 versus MERS-CoV (blue dots) for all viral baits (all), viral baits found in the same cellular compartment (yes), and viral baits found in different compartments (no).

