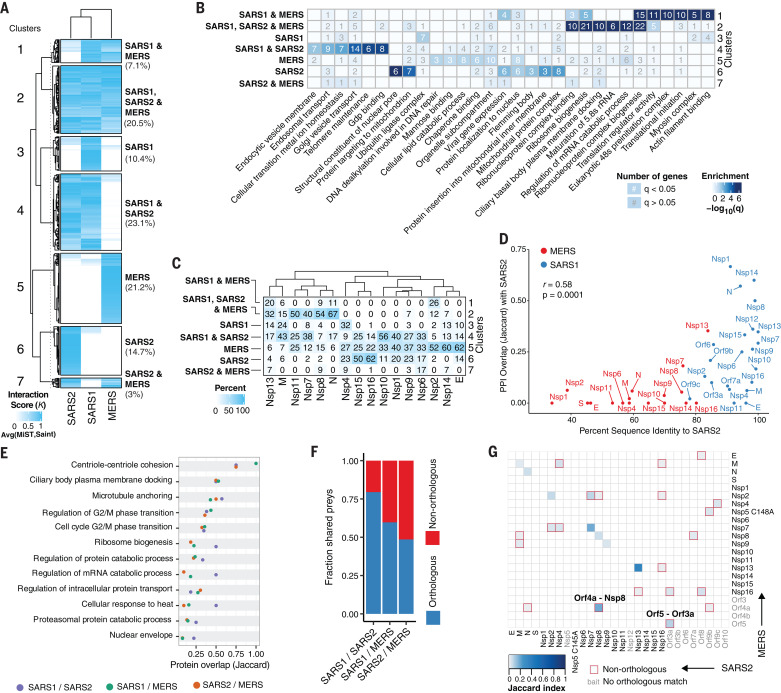
Fig. 3. Comparative analysis of coronavirus-host interactomes.
(A) Clustering analysis (K-means) of interactors from SARS-CoV-2, SARS-CoV-1, and MERS-CoV, weighted according to the average between their MiST and SAINT scores (interaction score K). Included are only viral protein baits represented amongst all three viruses and interactions that pass the high-confidence scoring threshold for at least one virus. Seven clusters highlight all possible scenarios of shared versus individual interactions, and percentages of total interactions are noted. (B) GO enrichment analysis of each cluster from (A), with the top six most-significant terms per cluster. Color indicates −log10(q), and the number of genes with significant (q < 0.05; white) or nonsignificant enrichment (q > 0.05; gray) is shown. (C) Percentage of interactions for each viral protein belonging to each cluster identified in (A). (D) Correlation between protein sequence identity and PPI overlap (Jaccard index) comparing SARS-CoV-2 and SARS-CoV-1 (blue) or MERS-CoV (red). Interactions for PPI overlap are derived from the final thresholded list of interactions per virus. (E) GO biological process terms significantly enriched (q < 0.05) for all three virus PPIs with Jaccard index indicating overlap of genes from each term for pairwise comparisons between SARS-CoV-1 and SARS-CoV-2 (purple), SARS-CoV-1 and MERS-CoV (green), and SARS-CoV-2 and MERS-CoV (orange). (F) Fraction of shared preys between orthologous (blue) and nonorthologous (red) viral protein baits. (G) Heatmap depicting overlap in PPIs (Jaccard index) between each bait from SARS-CoV-2 and MERS-CoV. Baits in gray were not assessed, do not exist, or do not have high-confidence interactors in the compared virus. Nonorthologous bait interactions are highlighted with a red square. GO, gene ontology; PPI, protein-protein interaction; SARS2, SARS-CoV-2; SARS1, SARS-CoV-1; MERS, MERS-CoV.

