Fig. 3.
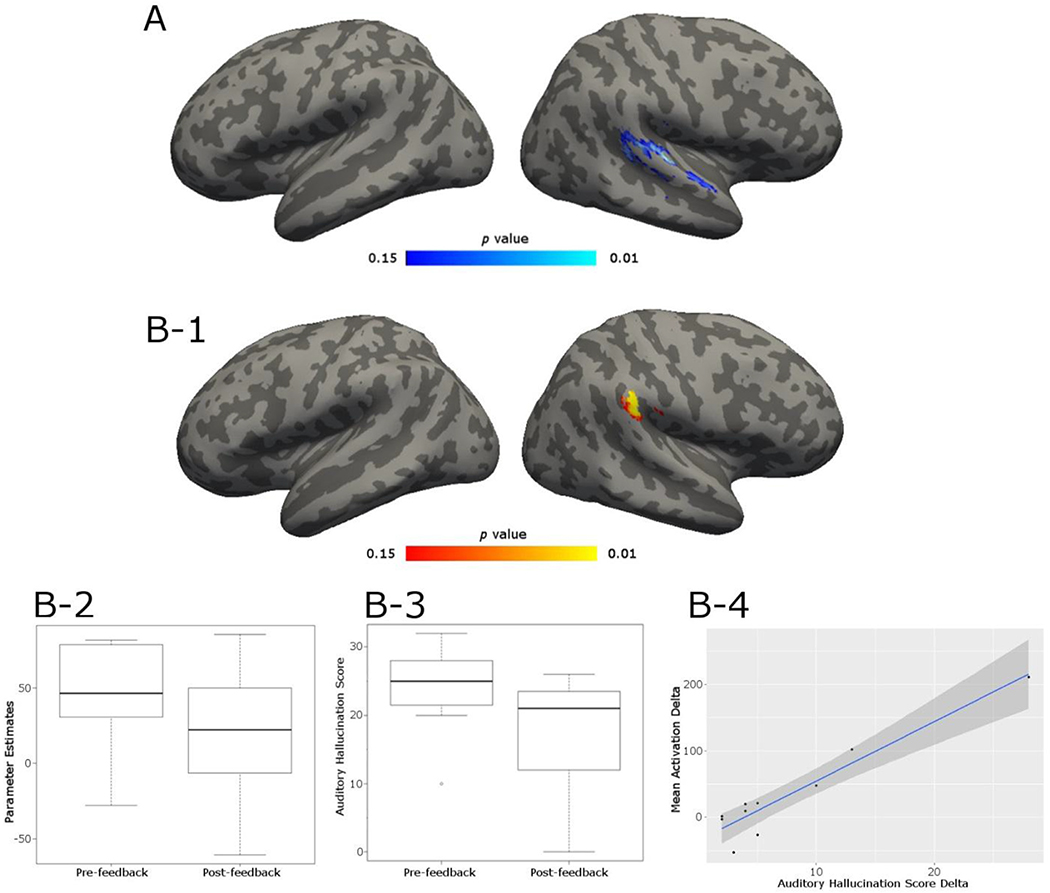
A. Feedback transfer task results: highlighted cluster shows the area where activations during ignore block were greater in the pre-neurofeedback relative to post-neurofeedback (pre > post) run in a STG ROI analysis. Blue color denotes less activation in highlighted regions post neurofeedback. Statistics are non-parametric and FWE-TFCE corrected. B-1. Highlighted cluster shows area where the difference in activation during “ignore” blocks computed as activation preminus activation post- neurofeedback is significantly correlated with AH score delta score (pre – post). Statistics are non-parametric and FWE-TFCE corrected. B-2: Histogram of mean activation in the significant cluster (B-1) pre- and post-feedback. B-3: Histogram of mean auditory hallucination scores pre- and post- feedback B-4. Correlation (rs = 0.78) between mean activation delta values and AH delta scores extracted from significant cluster. The dark gray funnel depicts 95% confidence interval. Upon removal of the outlier in the far top right, the correlation remains high (rs = 0.70).

