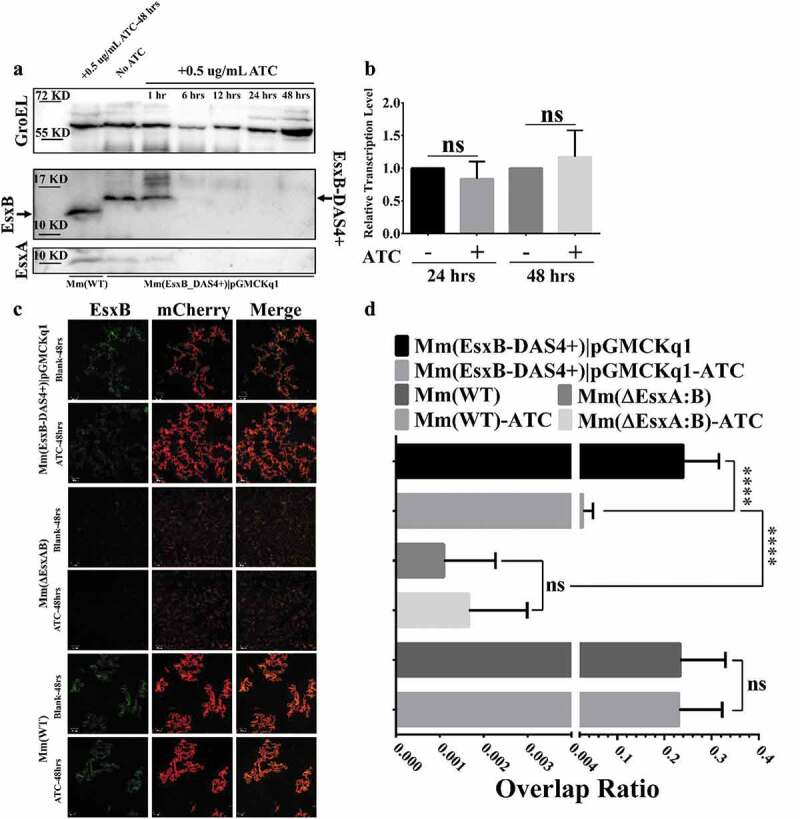
Figure 2.

ATC-induced knockdown of EsxB-DAS4+ at the post-translational level. (a) The Mm(EsxB-DAS4+)|pGMCKq1 culture was treated without ATC or with ATC (0.5 μg/ml) for the indicated times. As a control, the Mm(WT) culture was also treated with ATC (0.5 μg/ml) for 48 h. The expression of EsxB-DAS4+ and EsxA were detected by Western blots. The bands of EsxB and EsxB-DAS4+ are designated with arrows. (b) The relative mRNA level of EsxB-DAS4+ after 24 h and 48 h of ATC treatment was determined by RT-qPCR. The data from the non-ATC treated group was used as a control. The experiment was replicated for three times and the data is presented as mean ± SD. The statistical analysis was performed with t tests. (c) The mCherry-expressing Mm(EsxB-DAS4+)|pGMCKq1 cells were treated without or with ATC (0.5 μg/ml) for 48 h. Then the bacteria were incubated with anti-EsxB serum, followed by FITC-labeled secondary antibody, to detect the bacteria-associated EsxB-DAS4 +. Images from all groups were taken under a LSM700 confocal fluorescence microscopy with the same configuration. For each strain, 12 random sights were taken from two replicate wells. The scale bar represents 50 µm. (d) The Green/Red overlap ratio in the randomly selected fields was quantified. The left fragment of X-axis ranges from 0 to 0.004, and the right fragment ranges from 0.02 to 0.4. The IFA assay were replicated for three times and the data is presented as mean ± SD. The statistical analysis was performed with One-way ANOVA method, followed by Holm-Sidak multiple comparison. ****< 0.0001
