
Figure 6.
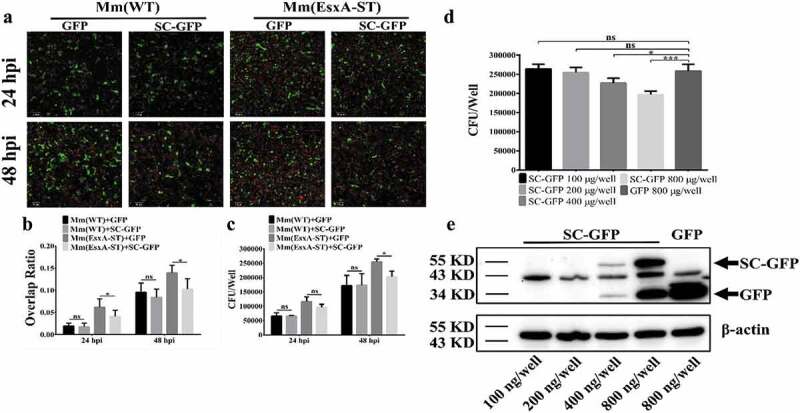
Endogenous expression of SC-GFP reduced Mm(EsxA-ST) intracellular survival in lung epithelial cells. (a) A549 cells were transiently transfected with pcDNA3.1-GFP or pcDNA3.1-SC-GFP. After 24 h of transfection, A549 cells were infected with Mm(WT) or Mm(EsxA-ST) at MOI = 2, respectively. At 24 and 48 hpi, the cells were fixed and images were taken at green channel and red channel to visualize GFP/SC-GFP and mCherry-expressing bacteria. For each strain, 12 random sights were taken from two replicate wells. Scale bar represents 50 μm. (b) The Red/Green overlap ratio of the cells in randomly selected fields was calculated to evaluate bacterial intracellular survival in transfect cells. (c) A549 cells were transiently transfected with pcDNA3.1-GFP or pcDNA3.1-SC-GFP. After 24 h of transfection, A549 cells were infected with Mm and Mm(EsxA-ST) at MOI = 2, respectively. At 24 and 48 hpi, the cells were harvested and subjected to CFU counting for intracellular survival. (d) A549 cells were transiently transfected with different concentrations of pcDNA3.1-SC-GFP DNA. After 24 h of transfection, A549 cells were infected with Mm(EsxA-ST) at MOI = 2. At 48 hpi, the cells were harvested and subjected to CFU counting for intracellular survival. The cells transfected with pcDNA3.1-GFP were used as the control. (e) The expression of SC-GFP in each transfection dose was detected with Western blots using anti-GFP antibody. The bands of SC-GFP and GPF are designated with arrows. β-actin was detected as a loading control. The intracellular survival experiment was replicated for three times and data is presented as mean ± SD. For the data in (B) and (C), statistical analysis was performed with multiple t-test between GFP and SC-GFP groups of each strain. *P< 0.05. For the data in (D), statistical analysis was performed with One-way ANOVA method, followed by Holm-Sidak multiple comparison. *P< 0.05, ***P< 0.001