Figure 4.

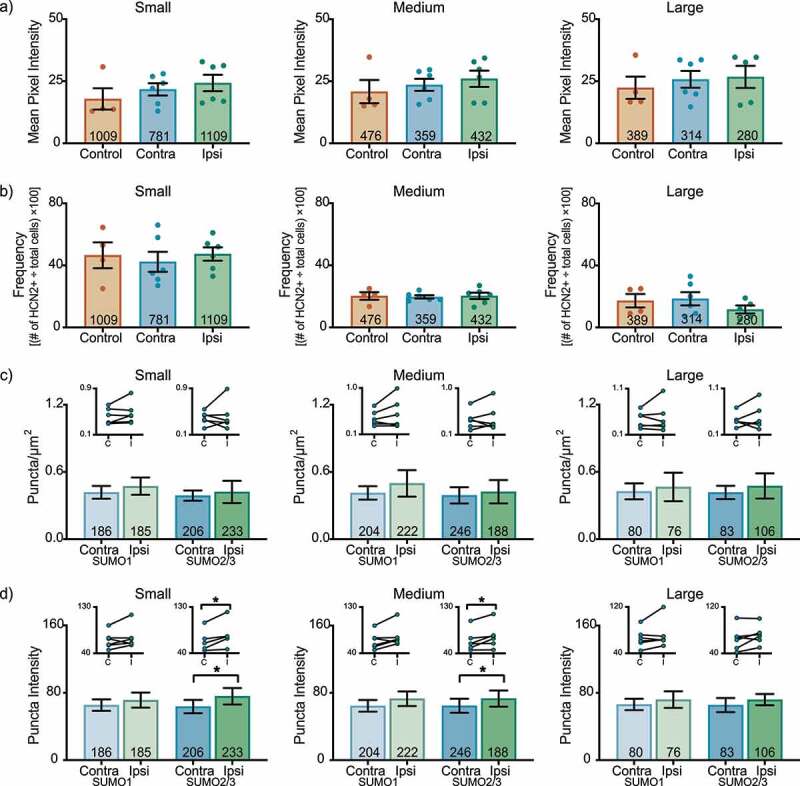
HCN2 SUMOylation but not protein expression is altered in the L6 DRG 3 days post-CFA. (a) HCN2 mean pixel intensities do not change 3 days post-CFA. Average mean pixel intensity ± SEM is shown for three size classes of DRG neurons (small: ≤ 30 µm; medium: 30–40 µm; large: > 40 µm). Each dot represents the mean for one animal. Note that data for left and right DRG from each control were combined, because paired t-tests indicated left and right DRG showed no significant differences. The total number of cells examined for all animals within the treatment group is indicated in the bar. Small cells: Kruskal-Wallis (2,13) = 2.842; p = 0.252; medium cells: Kruskal-Wallis (2,13) = 1.309; p = 0.543; large cells: Kruskal-Wallis (2,12) = 0.061; p = 0.977. (b) The percent of HCN2 expressing cells does not change 3 days post-CFA. Plot of percent HCN2 positive cells for each size class (frequency = # HCN2 positive cells for that size class ÷ total cells number for all classes). Bars indicate mean ± SEM. Small cells: one-way ANOVA F(2,13) = 0.206; p = 0.817; medium cells: one-way ANOVA (2,13) = 0.043; p = 0.958; large cells: one-way ANOVA F(2,12) = 0.932; p = 0.420. (c) The number of HCN2 SUMOylated channels is unaltered 3 days post-CFA. The number of puncta/µm2 for HCN2 SUMO1 (light bars) and SUMO2/3 (dark bars) conjugation is shown for three size classes of DRG neurons (small: ≤ 30 µm; medium: 30–40 µm; large: > 40 µm). SUMO1; small: 0.473 ± 0.077 vs 0.418 ± 0.057, p = 0.211, paired t-test; medium: 0.498 ± 0.118 vs 0.413 ± 0.06, p = 0.219, paired t-test; large: 0.466 ± 0.127 vs 0.427 ± 0.071, p = 0.593, paired t-test; SUMO2/3; small: 0.423 ± 0.099 vs 0.389 ± 0.046, p = 0.678, paired t-test; medium: 0.424 ± 0.104 vs 0.392 ± 0.073, p = 0.563, Wilcoxon matched-pairs, large: 0.475 ± 0.112 vs 0.417 ± 0.059, p = 0.563, Wilcoxon matched-pairs. Inset: compares the means for contralateral and ipsilateral DRG for each animal. (d) SUMOylated HCN2 Puncta Intensities are increased in small and medium cells. Plot of average puncta intensity ± SEM for each size class. SUMO1; small: 71.29 ± 8.984 vs 65.37 ± 6.805, p = 0.219, Wilcoxon matched-pairs; medium: 73.03 ± 8.633 vs 64.59 ± 6.927, p = 0.094, Wilcoxon matched-pairs; large: 72.02 ± 9.835 vs 66.21 ± 6.770, p = 0.313, Wilcoxon matched-pairs; SUMO2/3; small: 75.83 ± 9.743 vs 63.63 ± 7.899, p = 0.031, Wilcoxon matched-pairs; medium: 73.25 ± 9.620 vs 64.71 ± 8.353, p = 0.046, paired t-test; large cells: 71.93 ± 6.724 vs 65.46 ± 8.374, p = 0.148, paired t-test
