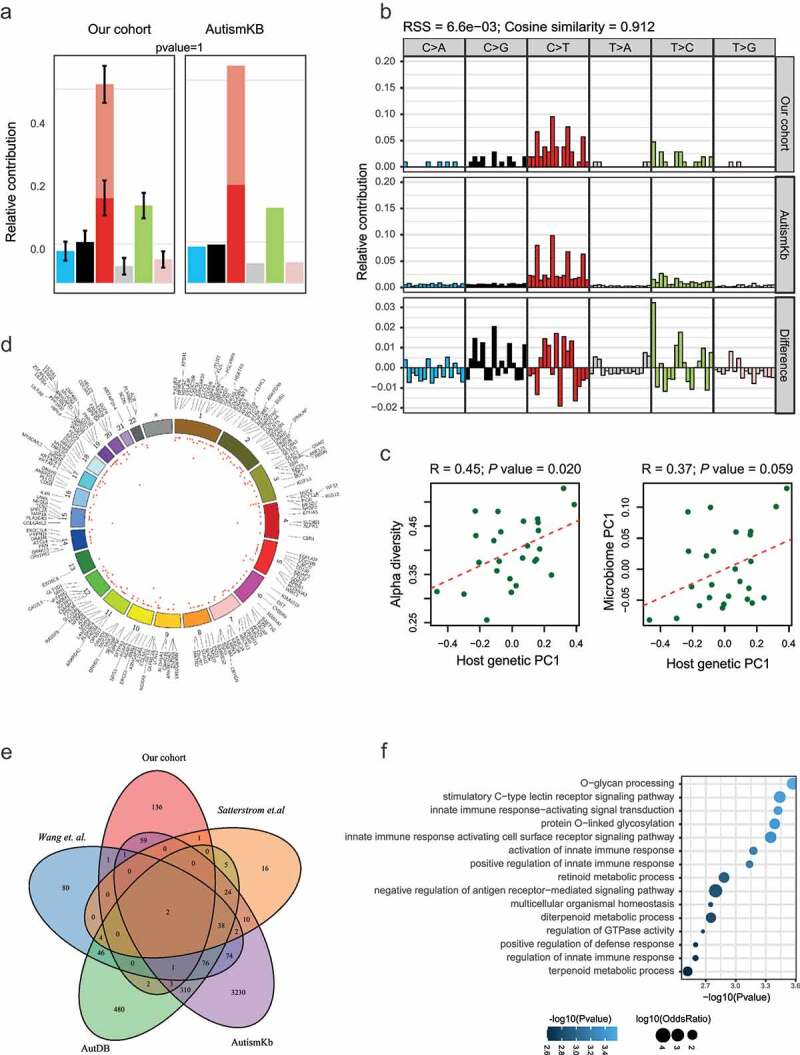
Figure 2.

SNVs enriched in ASD children. (A-B) The comparison of the mutation pattern (A) and mutation signature(B) between our identified SNVs and mutations collected from the AutismKb database. (C) Correlation of the first PC of host genetic data (x-axis) and alpha diversity (left panel) or first PC of the stool microbiome (right panel). (D) Circos plot of the functional SNVs enriched in ASD. The height of the points represents the number of mutant samples. Genes mapped by SNVs were labeled outside the circle. (E) Overlap of genes with the ASD enriched SNVs in our studies with those collected from other studies. (F) Functional annotation of genes with functional SNVs
