
Fig. 1.
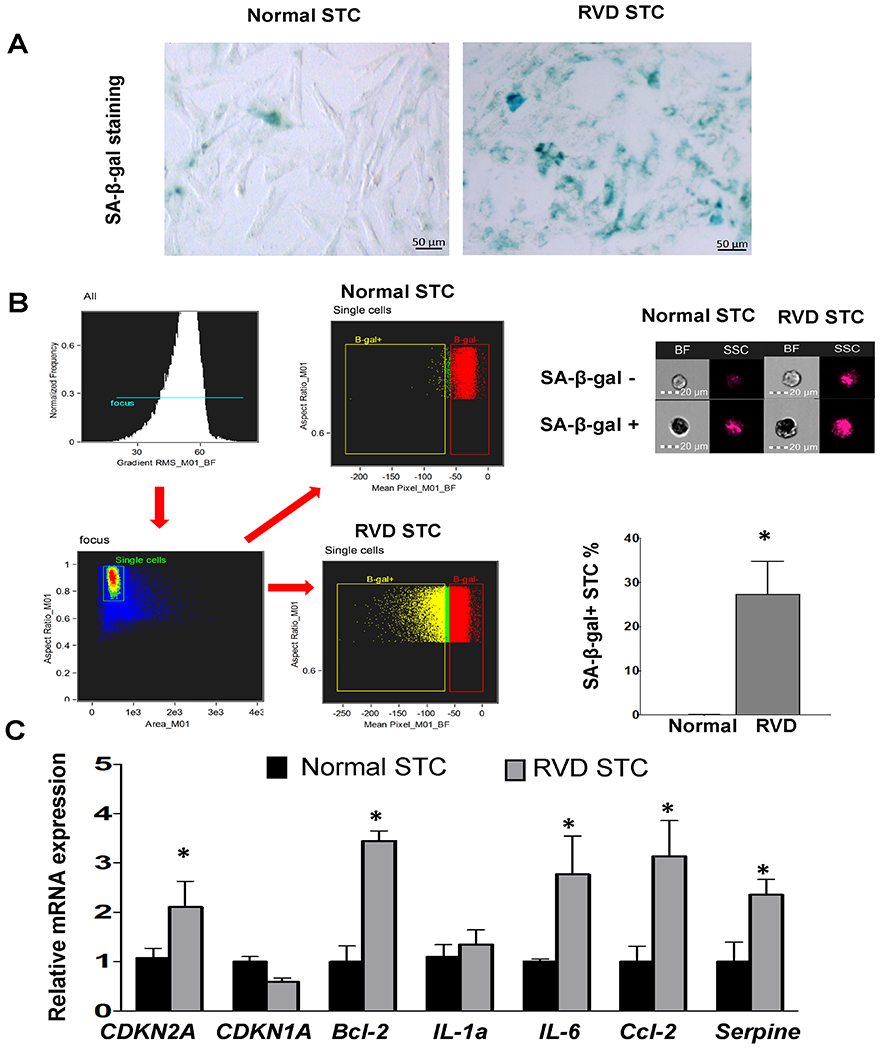
Characterization of renal scattered tubular-like cells (STC) from Normal and RVD pigs. A, Representative senescence-associated β-galactosidase (SA-β-Gal) staining of STC (Blue). B, Flow cytometry strategy: single-cells were gated first, and then mean bright field (BF) pixel intensity calculated for each event. SA-β-gal-positive (dark cells, low BF intensity) and SA-β-gal-negative (light-colored, high BF) populations were finally gated, expressed as percentage of total single-cells. The percentages of SA-β-gal-positive STC in RVD was higher than in Normal swine. C, Gene expression of senescence and SASP factors quantified by RT-PCR (relative to TBP). Mean±SD; Normal n=5-6, RVD n=5-6; *p<0.05 vs. Normal.