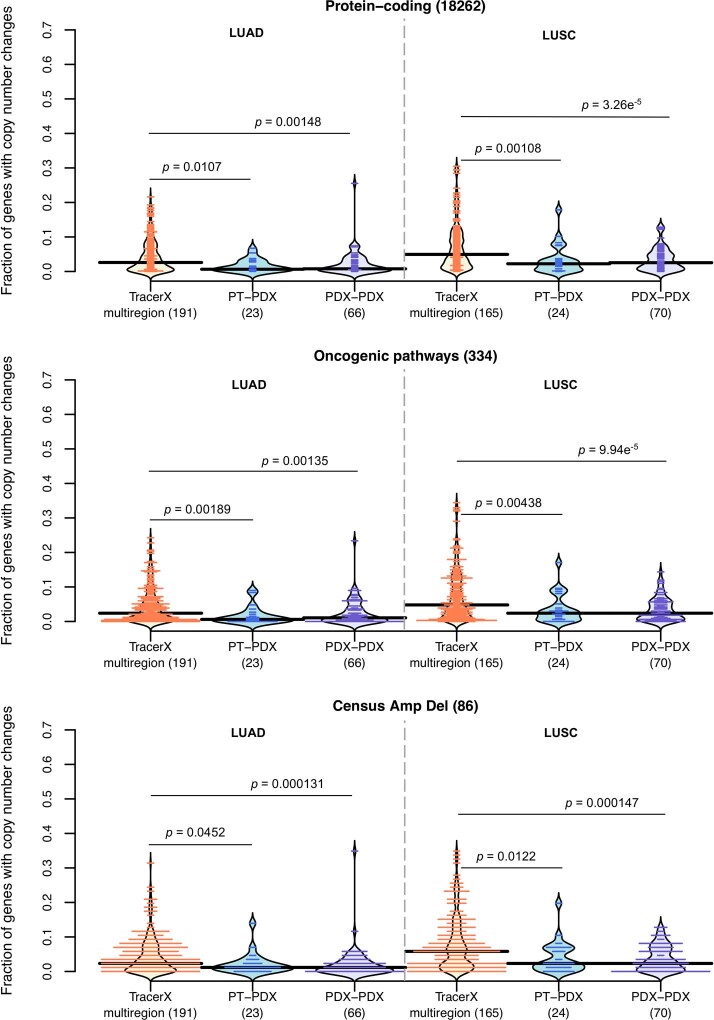
Extended Data Fig. 8. Distribution of proportion of altered genes for lung cancer samples.
Comparison between multi-region tumor pairs from TRACERx, and PT-PDX and PDX-PDX pairs for various gene sets for LUAD and LUSC. Gene sets and CNA thresholds are the same as Fig. 4, other gene sets are shown in Fig. 6b. P-values were computed by one-sided Wilcoxon rank sum test. Numbers of genes per gene set are indicated in the plot title, and number of pairwise comparisons are indicated in the horizontal axis labels.

