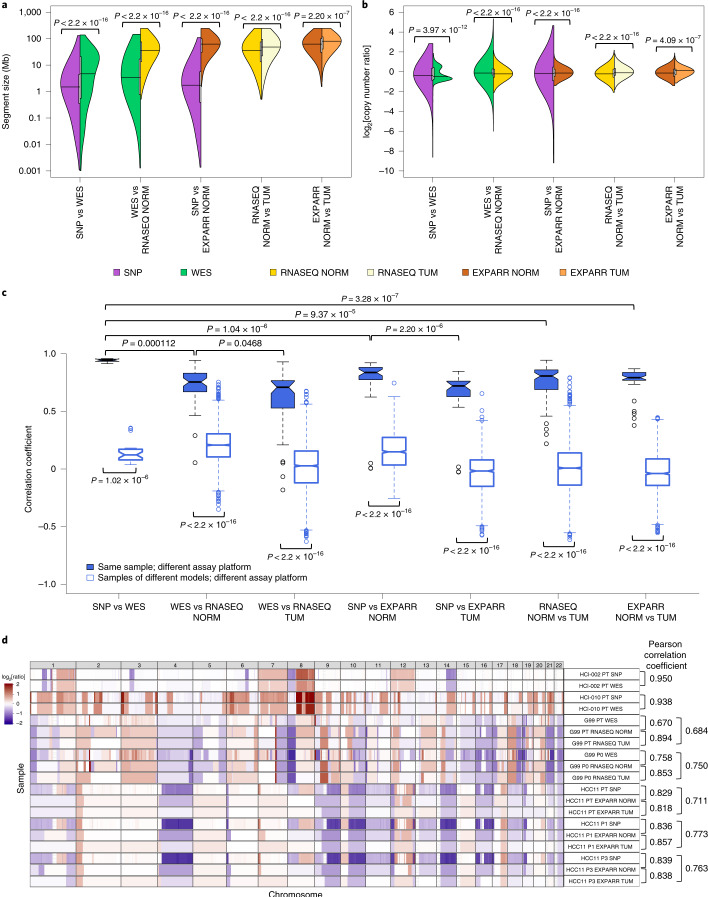
Fig. 2. Comparisons of resolution and accuracy for CNAs estimated using DNA- and expression-based methods.
a, Pairwise comparisons of the distributions of CNA segment sizes as estimated using different measurement platforms in the validation dataset. CNAs are regions with (|log2[copy number ratio]| ≥ 0.1). P values indicate the significance of the difference between distributions by two-sided Wilcoxon rank-sum test. vs, versus. b, Pairwise comparisons of the distributions of CNA segment log2[copy number ratio] values. P values were computed by two-sided Kolmogorov–Smirnov test. c, Distributions of Pearson correlation coefficients of median-centered log2[copy number ratio] values in 100-kb windows from CNA segments between pairs of samples estimated using different platforms. Samples with non-aberrant profiles in SNP array and WES data were omitted (5–95% inter-percentile range of log2[copy number ratio] < 0.3). P values were computed by two-sided Wilcoxon rank-sum test. In the box plots, the center line represents the median, the box limits are the upper and lower quantiles, the whiskers extend to 1.5× the interquartile range and the dots represent outliers. d, Examples of CNA profiles in comparisons of different platforms. Pearson correlation coefficients of CNA segments between pairs of samples are shown on the right. See Supplementary Table 3 for the number of samples per group. Examples of CNA profiles in comparisons of different platforms are shown; each sample ID is denoted by the model ID, passage number and platform used (see Supplementary Data 1).

