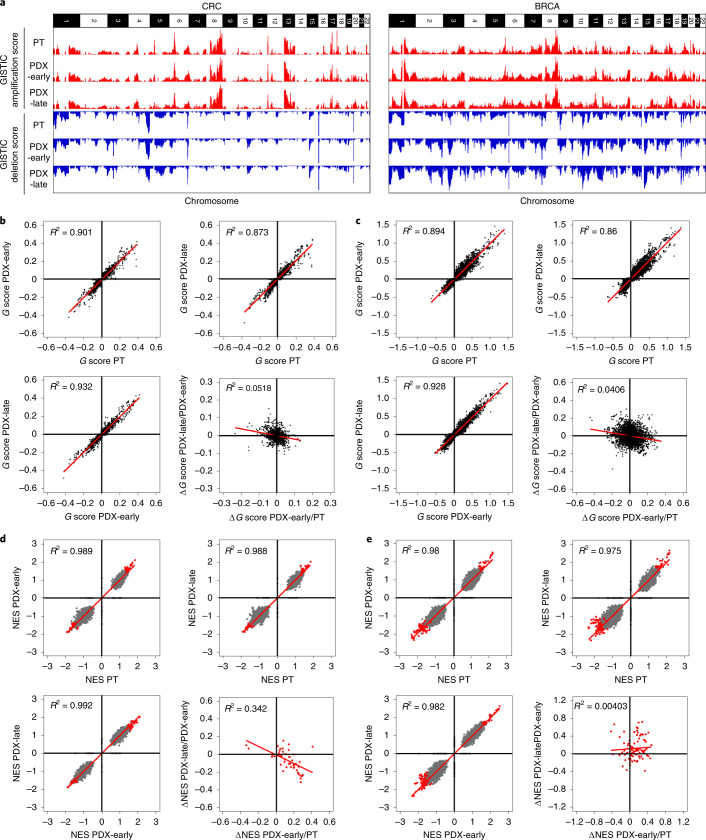
Fig. 5. Absence of mouse-driven recurrent CNAs during engraftment and propagation of CRC and BRCA PDXs.
a, Bar charts representing genome-wide G scores for amplifications and deletions in each of the three cohorts of CRC (left; 87 trios) and BRCA (right; 43 trios): PT, PDX-early (P0–P1 for CRC; P0–P2 for BRCA) and PDX-late (P2–P7 for CRC; P3–P9 for BRCA). b,c, Scatter plots comparing gene-level G scores between each of the three cohorts for CRC (b) and BRCA (c). The bottom-right panels of b and c show scatter plots comparing ΔG values from PT to PDX-early and from PDX-early to PDX-late. d,e, Scatter plots comparing GSEA NESs for gene sets between each of the three cohorts for CRC (d) and BRCA (e). The bottom-right panels of d and e show scatter plots comparing ΔNES from PT to PDX-early and from PDX-early to PDX-late. Gray data points represent all gene sets, whereas red data points represent gene sets significantly enriched in at least one of the three cohorts (that is, PT, PDX-early or PDX-late).

