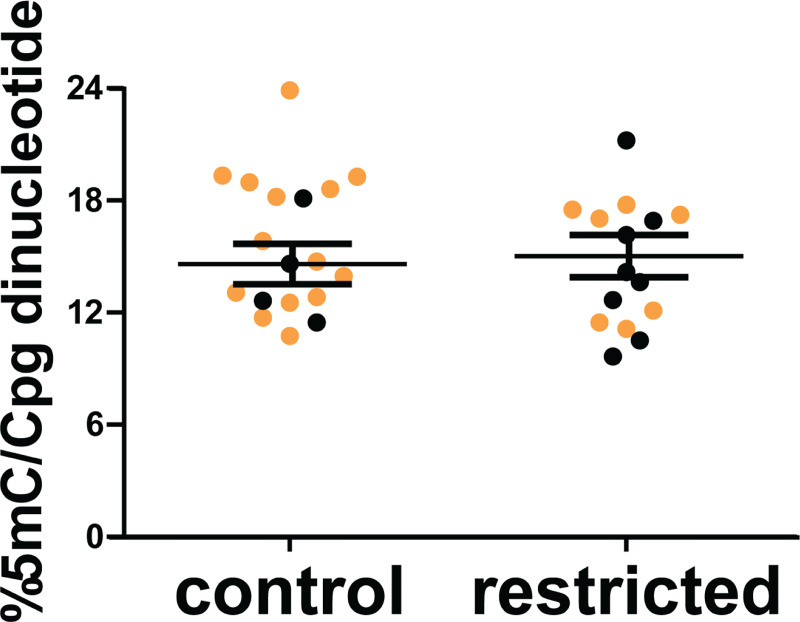
Fig 5. The overall percentage of CpG methylation (%5mC/CpG sites) in placentas from control and periconceptionally food-restricted dams was determined by ELISA.
Each marker represents an individual placenta. Black dots are female and gold dots are male. Horizontal lines represent least square means of each maternal treatment group, and error bars are SEM. N = 5 control dams and 6 restricted dams.

