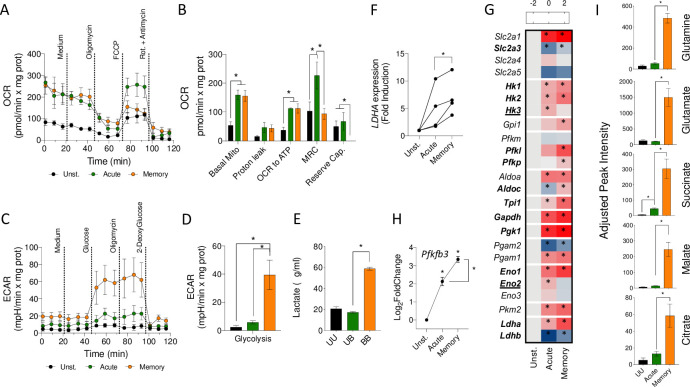
Fig 5. B. burgdorferi–induced metabolic changes in memory macrophages.
Normalized OCR (A and B) and ECAR (C and D) of unstimulated (black), acute (green), and memory BMMs (orange). (E) Lactate production by unstimulated (black), acute (green), and memory murine macrophages (orange), measured in the cell supernatants. (F) LDHA expression in acute and memory human peripheral blood monocytes, as determined by real-time PCR relative to the gene, RPLP0. (G) Heat map showing the expression levels of glycolytic genes in acute and memory murine macrophages. The red color represents the up-regulation of genes, whereas down-regulation is indicated in blue. The asterisks indicate the genes that showed significantly different expression levels compared to unstimulated (Unst.) cells. Genes in bold represent those significantly increased in memory cells compared to acutely stimulated macrophages. Bold, underlined genes represent those significantly decreased in memory cells compared to acutely stimulated BMMs. (H) Pfkfb3 gene expression changes in acute and memory macrophages in response to B. burgdorferi stimulation. (I) Intermediate metabolites of the TCA cycle in unstimulated (UU, black bars), acute (green bars), and memory (orange bars) BMMs. *, p < 0.05. The data underlying the graphs in Fig 5 can be found in S5 Data and GSE125503. BMM, bone marrow-derived macrophage; ECAR, extracellular acidification rate; FCCP, carbonyl cyanide-4-(trifluoromethoxy)phenylhydrazone; OCR, oxygen consumption rate; PCR, polymerase chain reaction; Rot, rotenone; TCA, tricarboxylic acid cycle.

