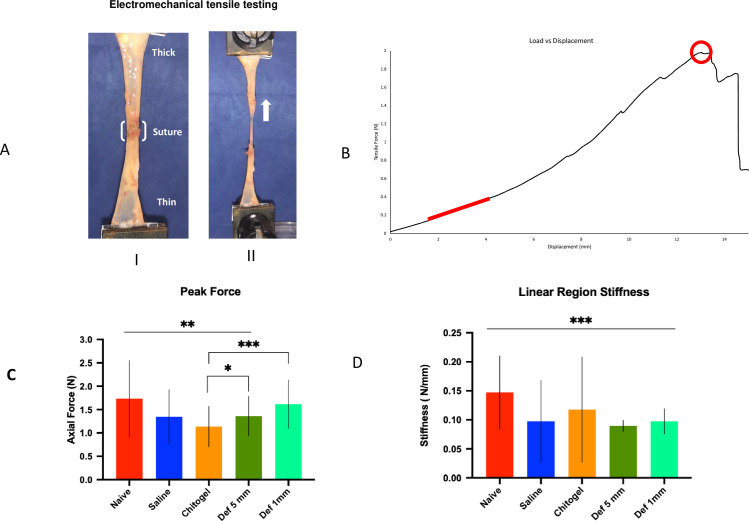
Fig 5. Electromechanical tensile strength testing.
(A) Experimental set up showing specimen caecum split open and fixed to the Instron pneumatic arms with sutured area at its centre before being stretched (thick white arrow indicates direction of pull) for electromechanical tensile testing. (B) Load displacement graph showing value of tensile force [in Newton(N)] vs displacement [in millimetre(mm)]. The red line represents the linear region, from which the stiffness was calculated, and the red circle indicates the peak load location. (C) Bar graph of peak axial force [in Newton (N)] for the different treatment groups ***p<0.001, * p<0.05, (D) Bar graph of Linear region stiffness [in Newton/mm (N/mm)] of caecum in different treatment groups specimens. *** p<0.001, compared to Naïve tissue.

