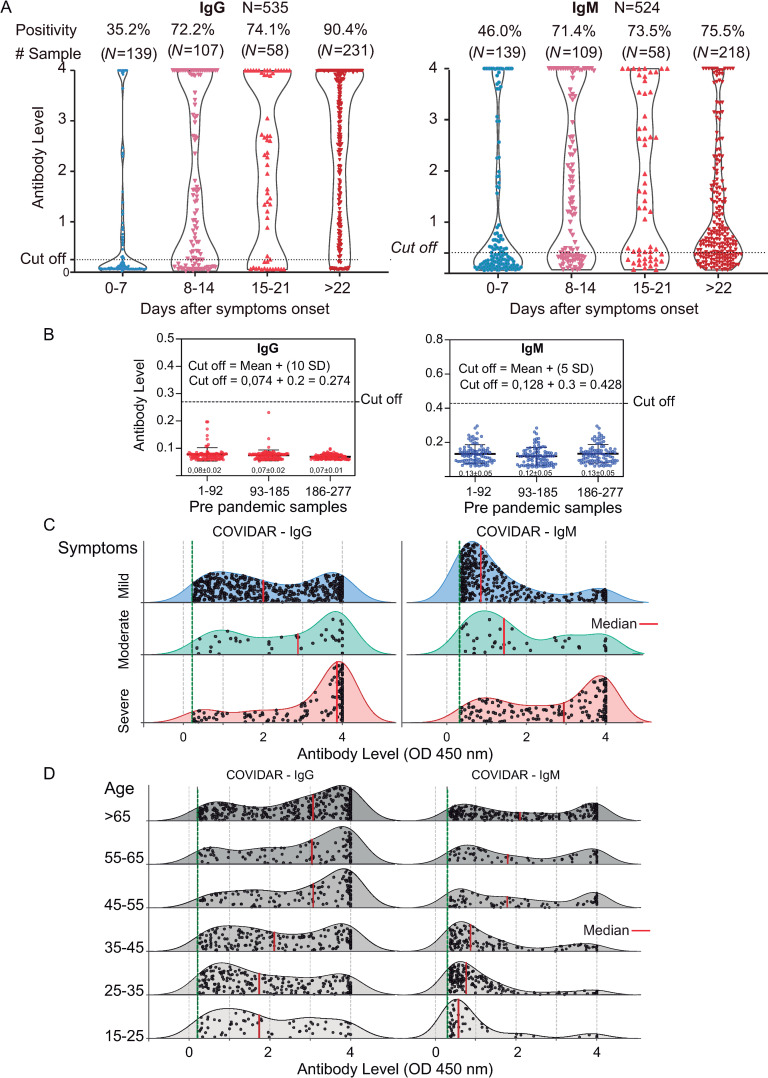
Fig 1. Antibody responses against SARS-CoV-2.
A. Levels of specific IgG and IgM antibodies against SARS-CoV-2 (measured as OD at 450 nm) versus days of symptoms onset in 535 patient serum samples are shown. The positivity rate and sample size for each week are indicated on the top. The cut-off is also shown. B. Levels of IgG and IgM antibodies against SARS-CoV-2 in 277 pre-pandemic serum samples. The cut-off definition is shown. C. Comparison of the levels of IgG and IgM antibodies against SARS-CoV-2 from patients with severe, moderate and mild symptoms. For each plot, the red lines indicate median values. D. Comparison of the level of IgG and IgM antibodies against SARS-CoV-2 from patients of different ages. The number of samples analyzed for C and D was 1379 and 976, respectively.

