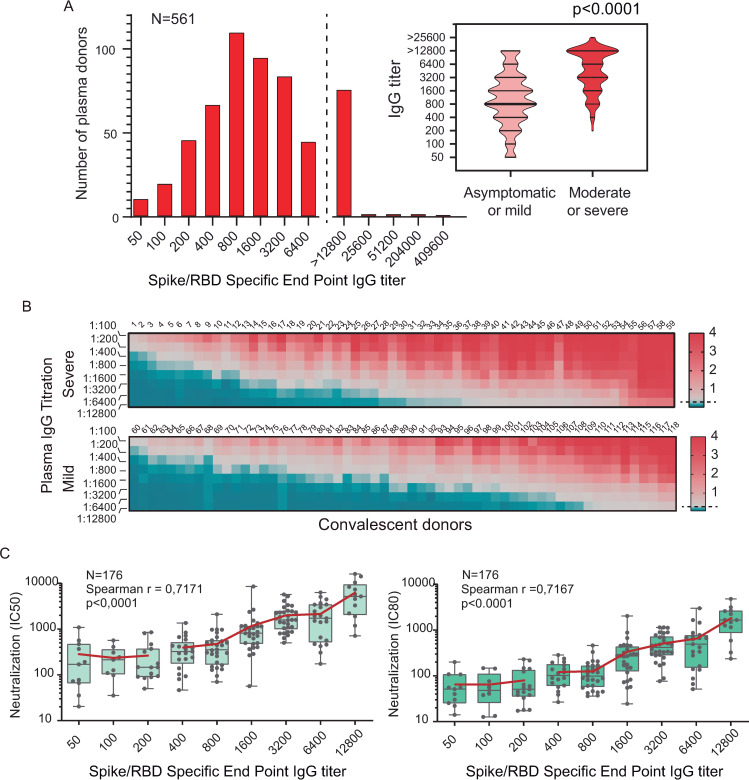
Fig 5. Quantification of IgG levels in COVID-19 convalescent patients and correlation with neutralizing activity.
A. IgG titers were defined by end dilution with COVIDAR ELISA test in convalescent-phase COVID-19 patients who were discharged from the hospital (n = 561). On the right, plot of titer distribution showing significant differences (p <0.0001, Mann-Whitney test) between samples from donors that have experience mild or severe symptoms. B. Full IgG titrations curves of plasma sample from donors that recovered from severe or mild COVID19 were used to generate heat maps. Red represents high and blue low antibody levels as indicated on the right. Samples were sorted by increasing titers. C. Correlation of IgG end point titration and neutralizing antibody titers in COVID-19 patients measured by pseudovirus CoV2pp (n = 176). The reciprocal of inhibition concentration 50% and 80%, IC50 and IC80 respectively, are correlated to the reciprocal end point IgG titers. In the inset the r Spearman and p values from linear regression are shown. Boxes indicate the median, and the red line the mean of IC50 or IC80 for each IgG titer.

