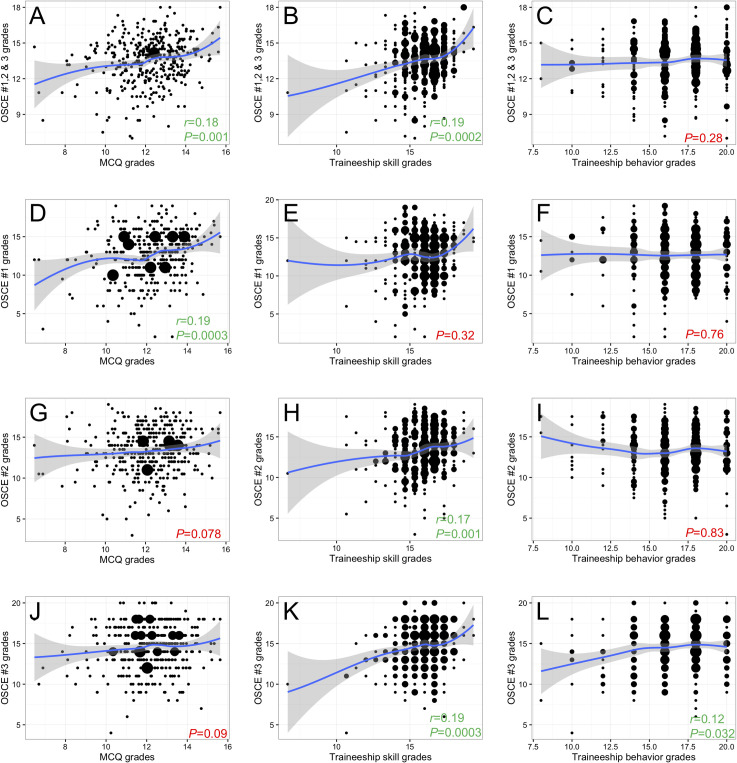
Fig 3. Scatterplots of the relationships between OSCE grades and mean fourth-year teaching unit grades.
(A-C) Mean OSCE grades versus mean fourth-year multiple-choice question (MCQ)-based examination grades, traineeship skill and traineeship behavior grades. (D-F) Mean OSCE #1 grades versus mean fourth-year MCQ-based examination, traineeship skill and traineeship behavior grades. (G-I) Mean OSCE #2 grades versus mean fourth-year MCQ-based examination, traineeship skill and traineeship behavior grades. (J-L) Mean OSCE #3 grades versus mean fourth-year MCQ-based examination, traineeship skill and traineeship behavior grades. To highlight trends, a smoothing regression line was added to each plot using the geom_smooth function (R Software, ggplot2 package). P values and Spearman r coefficient were highlighted in green for significant and in red for non-significant correlations, respectively.

