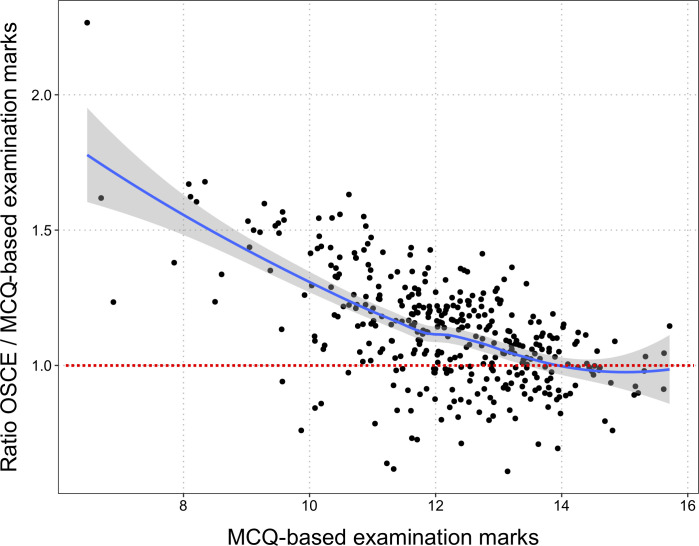
Fig 5. Dot plot of the relationship between multiple-choice question (MCQ)-based grades obtained for teaching units and the ratio of the OSCE grades and those MCQ-based grades.
This plot highlights graphically that MCQs and OSCE evaluates students differently, since a non-neglectable proportion of students obtained better grades at OSCE than at MCQs, and more so among students with middle- or low-range grades at MCQs. To facilitate the reading, the dotted red line indicates the OSCE/MCQ ratio equal to 1.0. Students with an OSCE/MCQ ratio lower than 1.0 have a lower grade on the OSCE than the MCQ-based exam.

