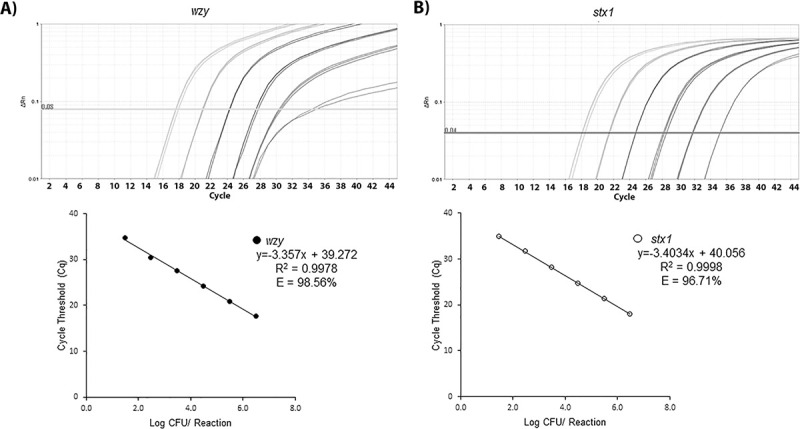
Fig 1. Determination of the detection limit of the qPCR assay.

Calibration curves generated using 10-fold dilutions of DNA standards for E. coli EDL933_2 (top) detecting the wzy (A) and stx1 (B) genes. The Cq values were plotted against the log-scale CFU per reaction target concentration (bottom). The R2 values and reaction efficiency (E) are also shown.
