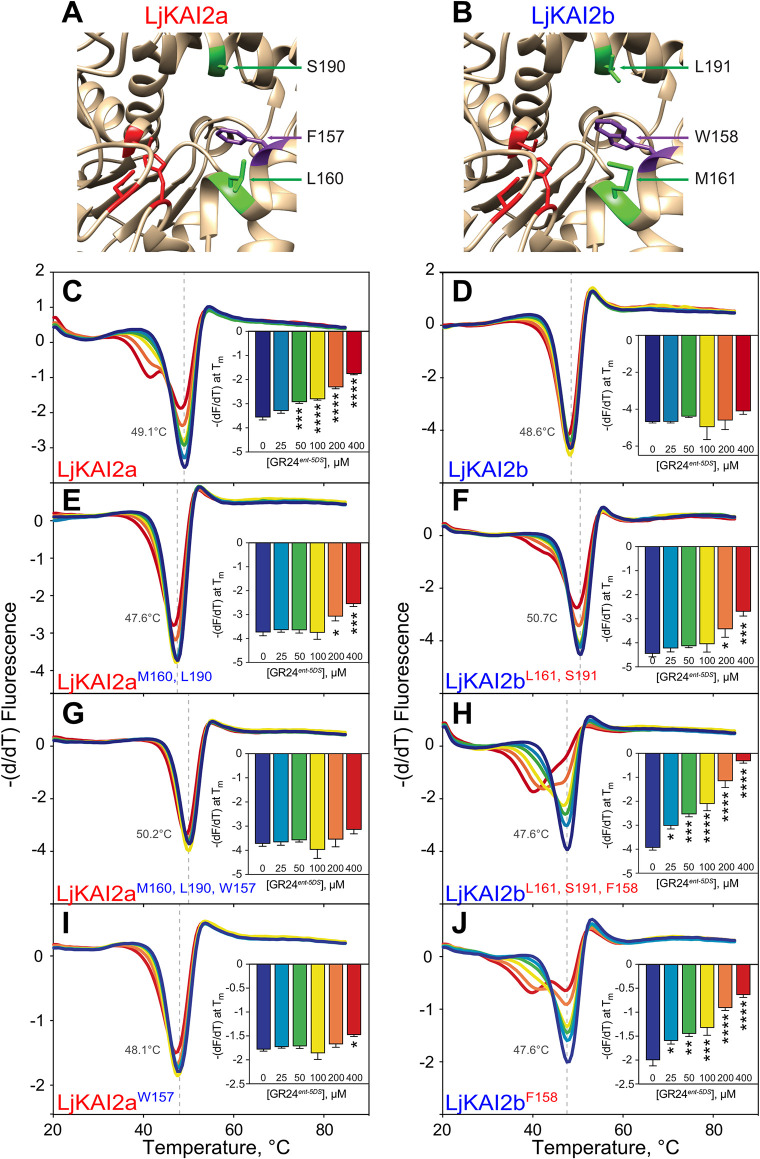
Fig 4. Binding of GR24ent-5DS to LjKAI2a is determined by three amino acids.
(A-B) The ligand-binding cavity regions of LjKAI2a and LjKAI2b proteins after structural homology modelling on the KAI2 crystal structure of A. thaliana [5]. Conserved residues in the cavity that differ between the KAI2a and KAI2b clades, and that are also different between LjKAI2b and AtKAI2, are shown in green. The phenylalanine residue in LjKAI2a, which is changed to tryptophan in LjKAI2b, is shown in violet. The catalytic triad is coloured in red. (C-J) DSF curves of purified SUMO fusion proteins of (C-D) wild-type LjKAI2a and LjKAI2b, and (E-J) versions with swapped amino acids (E-F) LjKAI2aM160,L190, LjKAI2bL161,S191, (G-H) LjKAI2aW157,M160,L190, LjKAI2bF158,L161,S191, (I-J) LjKAI2aW157, LjKAI2bF158 at the indicated concentrations of GR24ent-5DS. The first derivative of the change of fluorescence was plotted against the temperature. Each curve is the arithmetic mean of three sets of reactions, each comprising four technical replicates. Peaks indicate the protein melting temperature. The shift of the peak in LjKAI2a indicates ligand-induced thermal destabilisation consistent with a protein-ligand interaction. Insets plot the minimum value of (-dF/dT) at the melting point of the protein as determined in the absence of ligand (means ± SE, n = 3). Asterisks indicate significant differences to the solvent control (ANOVA, post-hoc Dunnett test, N.S.>0.05, *≤0.05, **≤0.01, ***≤0.001, ****≤0.0001).

