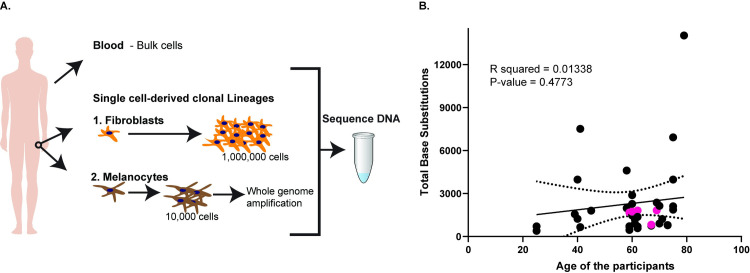
Fig 1. Schematics and total base substitutions identified per clonal lineage in this study.
(A) Schematics of the study design. From each donor, we obtained blood for whole-genome sequencing. In addition, we obtained skin biopsies from the hips of the donors from which fibroblasts and melanocyte clonal lineages were obtained. Fibroblasts were grown up to a million cells and their DNA was directly used for whole-genome sequencing, while melanocytes grew up to 10,000 cells and the DNA was whole-genome amplified and thereafter sequenced. (B) The total base substitutions in each clonal lineage versus the age of the donors. The pink filled circles denote melanocyte clones. The x-axis denotes the ages of the donors, while the y-axis denotes the number of base substitutions. The solid black line is the linear regression line for the samples, while the dotted black curves are the 95% confidence intervals. The source data for this figure is in S1 and S2 Tables.

