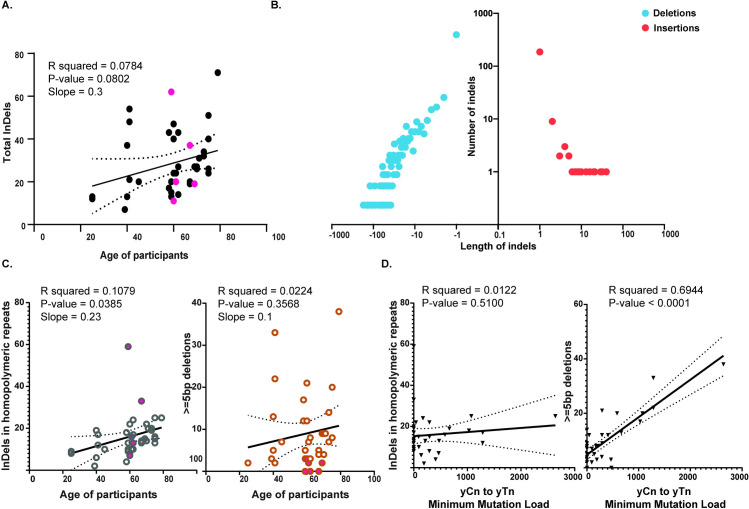
Fig 3. Analyses of indels in skin cells.
(A) The total number of indels identified in each sample plotted against the ages of the donors. The black dots denote fibroblast clones, while the pink dots denote the melanocyte clones. (B) The distribution of the lengths of the insertions and deletions detected in the clonal lineages. The source data for panels A and B is in S6 Table. (C) The number of insertions and deletions in homopolymeric repeats and the deletions spanning 5 bases or more plotted against the ages of the donors. The open circles denote fibroblast clones, while the filled in circles denote melanocyte clones. The source data for this figure are in S7 Table. (D) The number of insertions and deletions in homopolymeric repeats and the deletions spanning five bases or more plotted against the yCn➔yTn minimum mutation load in skin cells. The source data for this panel are in S4 and S6 Tables. In the graphs, the black solid line is the linear regression of the data, and the dotted black curves are the 95% confidence intervals.

