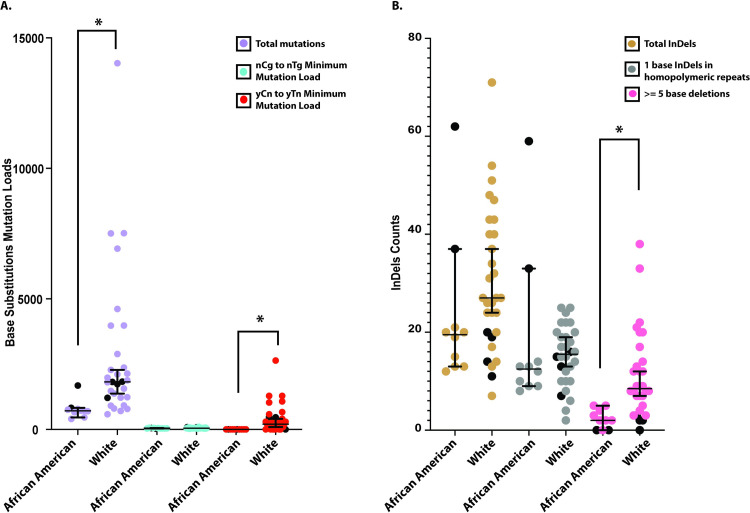
Fig 4. Base substitutions and indels in African American and White donors.
(A) The total number of base substitutions, the nCg➔nTg minimum mutation load and the yCn➔yTn minimum mutation load in African American and White donors. Melanocytes are depicted as filled black circles. (B) The total number of indels, single nucleotide indels in homopolymeric repeats and deletions spanning five bases or more in the African American and White donors. Melanocytes are depicted as filled black circles. A two-sided Mann-Whitney U-test was performed to compare the mutation load across the two cohorts. * denotes a Bonferroni corrected P-value < 0.05. The source data for this figure is in S10 Table.

