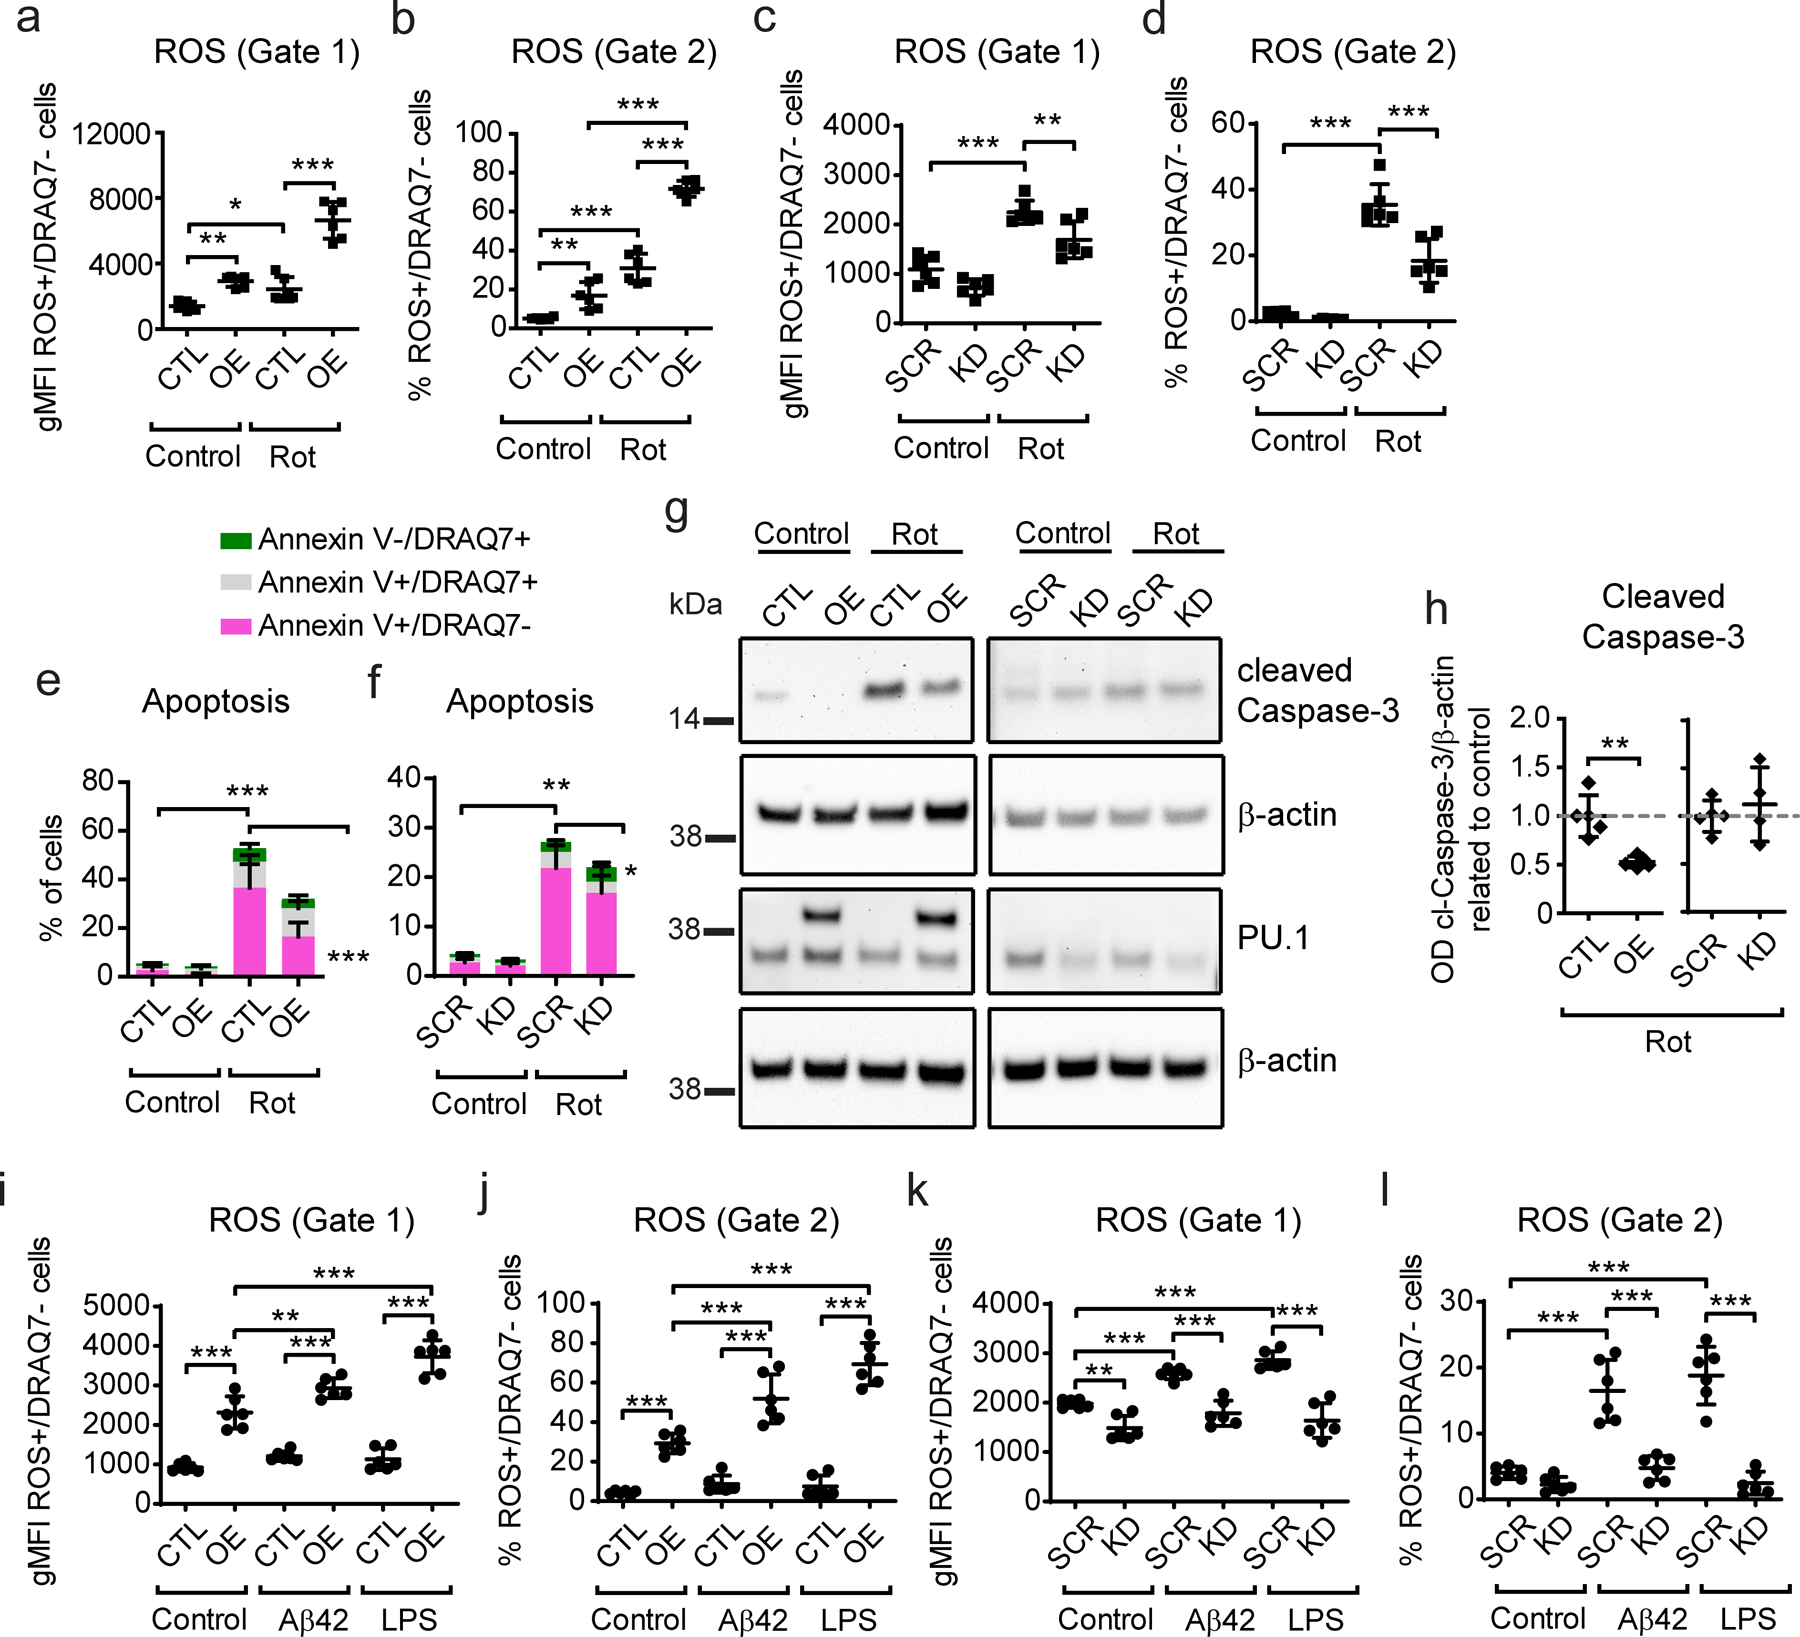
Figure 4. Stable PU.1 overexpression increases and knock-down decreases rotenone-dependent cell death and production of reactive oxygen species in BV2 microglial cells.

(a, c) Quantification of ROS intensity and (b, d) number of ROS+/DRAQ7− cells in PU.1 overexpressing and knock-down cells after rotenone treatment based on gate 1 for the whole cell population and gate 2 for the rotenone-reactive cells set in Supplementary Fig. S6a–b. (e, f) Analysis of the number of early, late apoptotic and necrotic cells with (e) PU.1 overexpression and (f) knock-down after rotenone treatment. (g) Representative western blot image of caspase-3 activation and PU.1 levels after rotenone treatment. (h) Quantification of cleaved caspase-3 levels based on western blot as shown in (g). (i, k) Quantification of ROS intensity and (j, l) number of ROS+/DRAQ7− cells in PU.1 overexpressing and knock-down cells after Aβ42 and LPS treatment. Values shown are mean ± SD of (a–f, i–l) n = 3 independent experiments with two technical replicates each or (h) n = 4–5 independent experiments with one technical replicate. * P < 0.05, ** P < 0.01, *** P < 0.001. (a–f, j–l) One-way ANOVA with Bonferroni’s post-hoc multiple comparisons, (h) unpaired t test with Welch’s correction.
