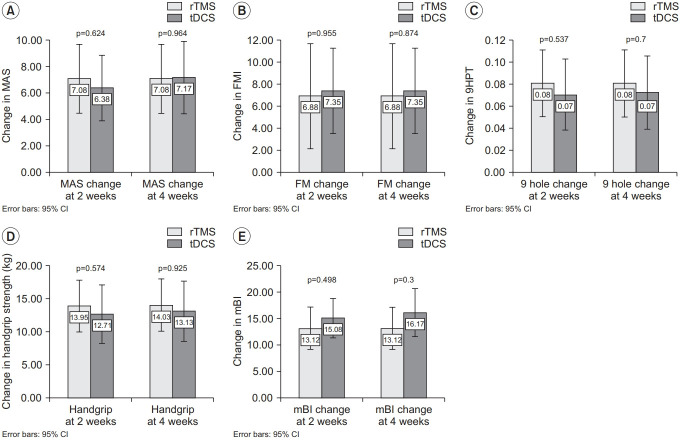
Fig. 3.
The between group differences in functional outcome. Changes in (A) MAS, (B) FM, (C) 9HPT, (D) handgrip strength, and (E) mBI from baseline. Each bar and 95% confidence interval (CI) represent the changes in functional scores in the rTMS group and tDCS group. rTMS, repetitive transcranial magnetic stimulation; tDCS, transcranial direct current stimulation; MAS, Motor Assessment Scale; FM, Fugl-Meyer arm score test; 9HPT, Nine-Hole Peg Test; mBI, modified Barthel Index.

