Figure 2.
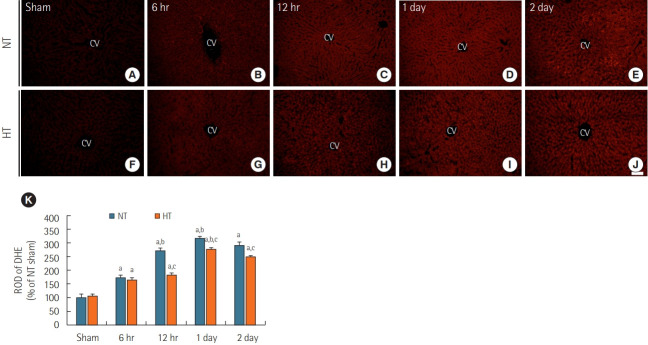
Dihydroethidium (DHE) fluorescence staining in liver sections of normothermia (NT; A-E) and hypithermia (HT; F-J) groups at sham, 6 hours, 12 hours, 1 day, and 2 days after asphyxial cardiac arrest (ACA). Very weak DHE fluorescence was observed in the NT/sham and HT/sham groups. DHE fluorescence in both NT/ACA and HT/ACA groups gradually increased over time, but DHE fluorescence in the HT/ ACA group was lower than that in the NT/ACA group. CV: central vein. Scale bar=50 µm. (K) Relative optical density (ROD) of DHE fluorescence in all groups (n=7 at each time after ACA, aP<0.05, significantly different from NT/sham group; bP<0.05; significantly different from previous time-point group; cP<0.05, significantly different from NT/ACA group). Bars indicate means±standard error of the mean.

