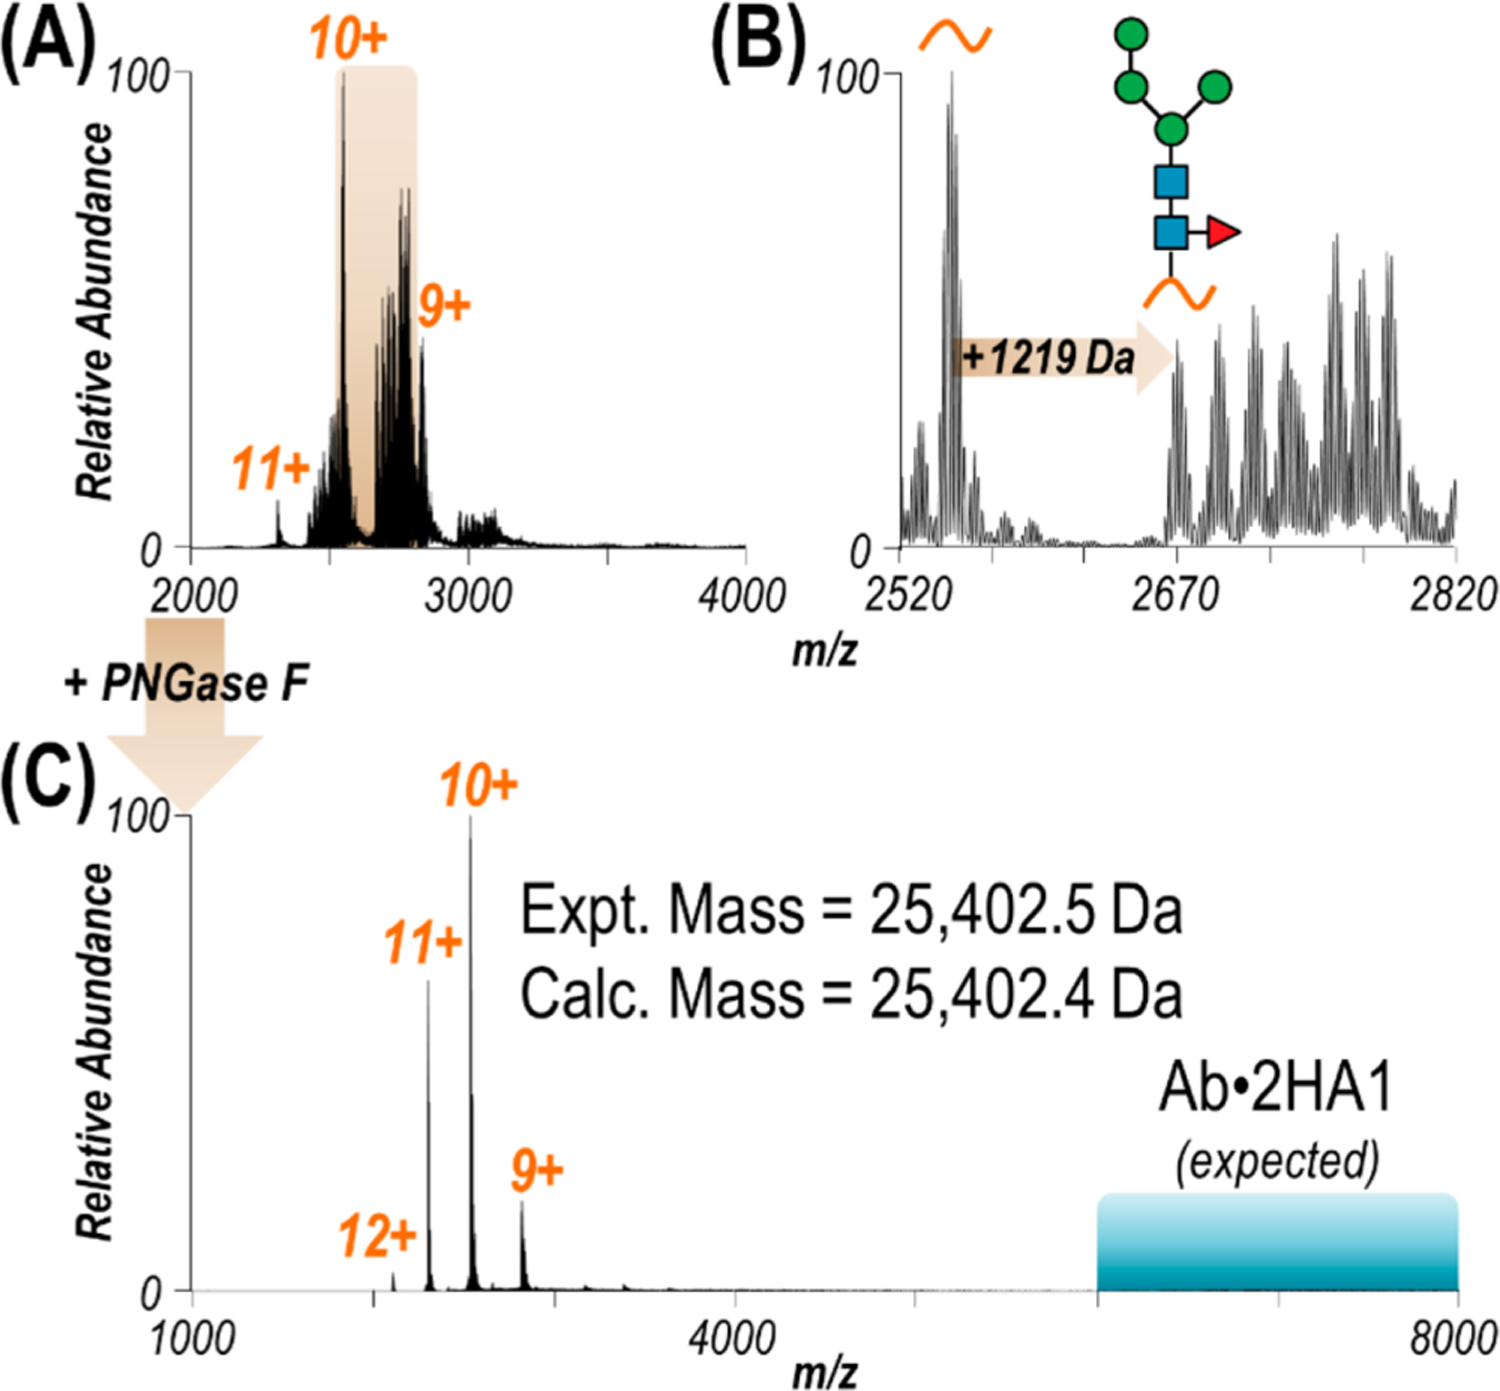
Figure 1.

(A) ESI mass spectrum of HA1 sprayed in 20 mM ammonium acetate. (B) Expanded view of the region of the spectrum spanning m/z 2520–2820 revealing several proteoforms of the 10+ charge state resulting from glycosylation. Based on a mass shift of +1219 Da, one possible glycan structure is shown, with up to six additional sugars accounting for all observed glycoforms. (C) ESI mass spectrum of HA1 after glycan removal with PNGase F. Observed as a monomer, the experimental mass of deglycosylated HA1 matches the calculated mass accounting for two disulfide bonds. The m/z region in which antibody·HA1 complexes would be expected is highlighted in turquoise.
